 iOS App Development
 Android App Development
 React Native
 Flutter
 Web Development
 Custom Software
 Front End Development
 Blockchain Development
 Virtual Reality
 Cloud Computing
 IoT Development
 Augmented Reality
 Write us a message
There are two kinds of enterprise mobile apps. The first kind gets built, gets launched, and gets handed to a maintenance team. Someone checks the crash rate occasionally. The roadmap is whatever the last stakeholder meeting requested. Success is measured by whether it shipped on time and whether it still works. The second kind has a revenue owner. It has a contribution margin target. It has a quarterly business review where session depth, conversion rate, and lifetime value are presented alongside the engineering velocity metrics. The team that builds it is accountable for the commercial outcomes it produces, not just the features it ships.
The enterprises winning on mobile are almost exclusively operating the second model. And the performance gap between the two is not marginal.
Global consumer spending on mobile apps reached $167 billion in 2025, growing 15 percent year over year (data.ai State of Mobile 2026, App Verticals analysis, March 2026). The mobile enterprise application market stood at $168.45 billion in 2025 and is projected to reach $303.56 billion by 2030 (Mordor Intelligence, 2025). In 2024, the global mobile app economy was valued at over $500 billion, driven by consumer spending, in-app advertising, and enterprise adoption (Alea IT Solutions, December 2025). The Apple App Store ecosystem alone facilitated $1.3 trillion in developer billings and sales in 2024 (App Verticals, March 2026).
These are not numbers that describe a feature category. They describe a business category. And the enterprises that recognize that distinction, that treat mobile as a revenue-generating business unit with its own P&L accountability rather than a technology project with a delivery date, are capturing a disproportionate share of what that category produces.
What Does It Mean to Treat a Mobile App as a P&L?
This is the question most enterprise leadership teams have never formally answered, which is precisely why most enterprise mobile strategies are underperforming.
Treating a mobile app as a P&L means assigning a named business owner who is accountable for revenue contribution, not feature delivery. It means the app has a defined cost structure covering engineering, infrastructure, marketing, and support, and a defined revenue or value contribution that is measured against that cost on a regular cadence. It means mobile app ROI is not an afterthought calculated at year-end but a live metric that informs every roadmap decision: which features drive retention, which flows drive conversion, which friction points are costing the business money per session. And it means the quarterly conversation about the app is a business conversation, not a technology status update.
The contrast with the project model is structural. In the project model, success ends at launch. The budget is closed when the app ships. The team disbands or reduces to a maintenance function. Roadmap decisions are made by whoever has the most organizational influence rather than whoever has the best commercial data. There is no named owner of the gap between what the app could deliver and what it actually delivers.
That gap is where the value goes.
Why Do Most Enterprise Mobile Apps Underperform?
Most enterprise mobile apps underperform for the same set of reasons, and those reasons are almost entirely organizational rather than technical.
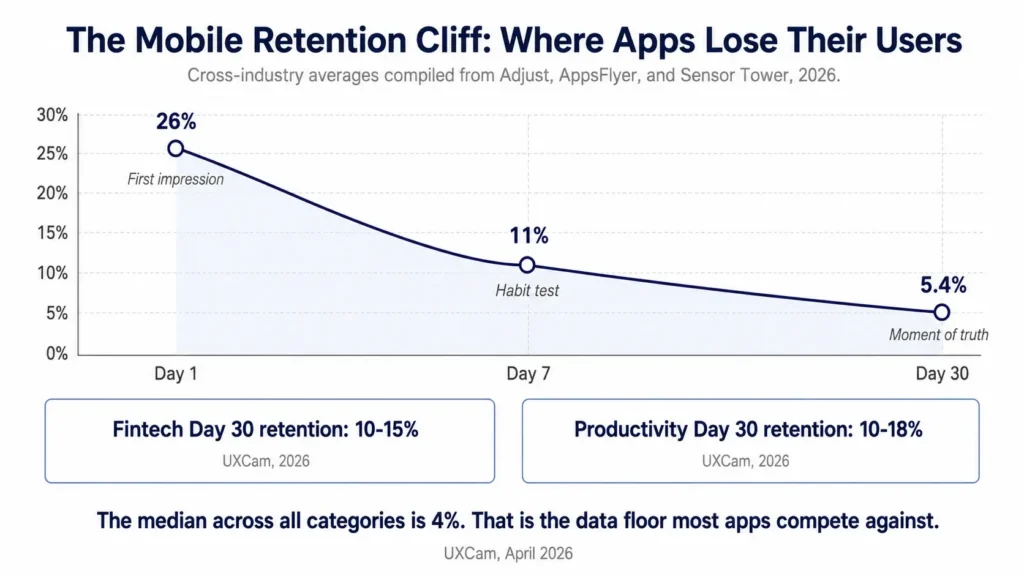
The average app loses 90 percent of its daily active users within the first 30 days (Business of Apps, via Snoopr analysis, February 2026). Cross-industry Day 30 retention averages just 5.4 percent across all categories, based on data aggregated from Adjust, AppsFlyer, and Sensor Tower across their published 2026 indices (Digital Applied, April 2026). Day 1 retention averages 26 percent, Day 7 retention averages 11 percent, and the cliff between Day 7 and Day 30 represents the specific window where most apps lose the users who were not yet converted into habits (Phiture, compiled from Adjust, AppsFlyer, Statista, and Business of Apps, April 2026).
These are not inevitable outcomes. They are the outcomes of apps that were built without P&L accountability. When nobody owns the retention rate, nobody fixes the onboarding flow that is losing 40 percent of first-session users before they reach the first meaningful value moment. When the roadmap is driven by feature requests rather than conversion funnel data, the friction that is costing the business money per session never gets prioritized for removal. When the quarterly review covers engineering velocity but not commercial performance, the compounding cost of a mediocre Day 30 retention rate is invisible to the people with the authority to change it.
The P&L model fixes this by making the commercial consequences of every product decision visible to the person accountable for the business outcome.
What Metrics Define a Mobile App P&L?
The metrics that constitute a mobile app P&L are different from the metrics that constitute a mobile app status report. Understanding the difference is the first step toward building the accountability model that drives performance.
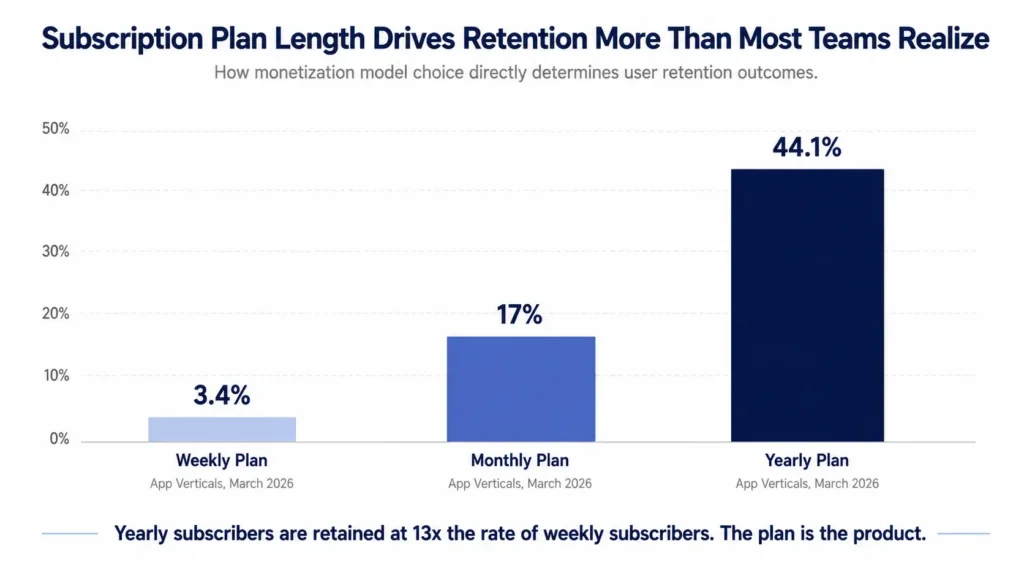
Revenue-side metrics: Daily Active Users and Monthly Active Users establish the engaged audience the app is monetizing. Average Revenue Per User measures the commercial yield of that audience. Lifetime Value by acquisition cohort shows which user sources produce the highest long-term return on acquisition investment. Subscription retention rates, which average 44.1 percent annually for yearly plans versus 17 percent for monthly plans (App Verticals, March 2026), show the compounding value of locking users into higher-commitment monetization structures.
Retention metrics that predict revenue: Day 1, Day 7, and Day 30 retention cohorts by acquisition source, onboarding variant, and user segment. Session depth and session frequency, which measure whether users are forming habits rather than using the app occasionally. Feature adoption rates for core value features, because users who have never reached the primary value moment of an app are users who have not yet been given a reason to return. Push notification opt-in rates, because apps with higher notification permission rates have a direct communication channel that is the highest-return retention lever available at no marginal cost.
Cost-side metrics: Customer Acquisition Cost by channel, because an app that generates strong LTV but acquires users at CAC that exceeds LTV is a business running at a structural loss. Infrastructure cost per user at scale, which determines the unit economics of growth. Engineering cost per feature shipped, which determines the efficiency of the roadmap investment. Support cost per user, which is often the most scalable cost category and the one most directly addressable through in-app design improvements that reduce confusion and error.
The P&L calculation: Contribution margin at the app level equals revenue minus variable costs including acquisition, infrastructure, and support per user per period. When that number is tracked quarterly against a target, the entire organization’s relationship with the mobile roadmap changes. Features that improve contribution margin get prioritized. Features that add cost without proportional revenue impact face scrutiny. And the conversation about what to build next is grounded in financial data rather than organizational politics.
Which Industries Are Winning With the P&L Model and What Are They Doing Differently?
The industries where mobile P&L discipline is most advanced are the ones where the financial consequences of mobile performance are most directly visible. Fintech, retail, and healthcare are the clearest examples.
Fintech. Digital-first financial services drove a 27 percent year-over-year increase in app installs in 2024, alongside a 24 percent rise in sessions (Adjust, Mobile App Trends, via Arounda Agency, March 2026). Finance app session length held steady at 6.59 minutes in the first half of 2025, up from 6.29 minutes in 2023 (Adjust, via Arounda Agency). Day 30 retention for fintech apps sits at 10 to 15 percent, significantly above the 5.4 percent cross-category average (UXCam, compiled from AppsFlyer, Adjust, and data.ai, April 2026). The reason fintech retains users at this rate is structural: the app is the product. There is no non-digital version of the service. The mobile team owns the entire customer relationship, which means they own the retention problem completely rather than sharing it with a physical channel. That single-ownership clarity is the organizational equivalent of a P&L.
Retail and ecommerce. Retail and ecommerce shows the highest forecast CAGR at 14.8 percent through 2030 in the enterprise mobile application development market (Mordor Intelligence, 2025). The enterprises winning in retail mobile are the ones that have connected their app’s performance metrics to their merchandising and marketing P&Ls, so that every session depth improvement is visible as a revenue contribution rather than a UX improvement.
Healthcare. In a documented healthcare workflow study, removing device reset tasks from clinical staff reduced device turnover time from 30 to 40 minutes to 3 to 5 minutes (Jamf, via Arounda Agency, March 2026). That is not a UX improvement. That is a labor cost reduction with a specific dollar value that is visible to the operations finance team. When mobile improvements produce outcomes that are this directly quantifiable, the P&L model is self-sustaining.
The pattern across all three industries is the same: the enterprises winning on mobile have found a way to make the financial consequence of every mobile performance improvement visible to the people making budget and roadmap decisions.
What Is the Organizational Structure Behind a Mobile P&L?
The P&L model is not primarily a measurement decision. It is an organizational design decision. The metrics only change behavior when the accountability structure gives someone both the responsibility for the outcome and the authority to make the decisions that drive it.
The mobile P&L owner. This role does not exist in most enterprises, which is the most important structural gap to address. The mobile P&L owner is accountable for the commercial performance of the app as a business unit. They are not the head of engineering, who is accountable for delivery. They are not the CMO, who is accountable for acquisition. They sit between those functions, translating user behavior data into product decisions and translating product decisions into financial forecasts. In consumer-first companies, this role is typically a VP of Product or a General Manager for mobile. In enterprise-first companies building mobile as a channel, it may require a new charter rather than a new hire.
The cross-functional team. The project model disbands the team at launch. The P&L model keeps the team intact and accountable for the post-launch performance of what they built. That team includes product management, design, engineering, data analytics, and growth, all reporting to or aligned with the mobile P&L owner and all measured on the commercial outcome of the app rather than the features they individually shipped.
The cadence. The P&L model requires a defined review cadence where commercial performance is examined with the same rigor as engineering velocity. Quarterly business reviews for mobile apps should cover revenue performance against target, retention cohort analysis, LTV by acquisition source, contribution margin trend, and the specific roadmap investments planned to address performance gaps. That cadence converts the P&L from a measurement framework into an accountability mechanism.
The budget model. Project budgets are finite. They end at launch. P&L budgets are continuous and tied to commercial performance. An enterprise that funds its mobile app as an ongoing business unit, with budget allocated to growth, retention, and product development on the basis of contribution margin performance, will consistently outinvest and outperform one that funds periodic project cycles punctuated by maintenance periods.
What Does the P&L Model Look Like in Practice: The Metrics That Matter Quarter by Quarter
Q1 focus: Activation and early retention.
The first quarter of any mobile P&L is dominated by onboarding performance. Apps that activate users within three minutes see nearly two times higher retention rates (UXCam, 2025). The specific metric to own in Q1 is the percentage of first-session users who reach the primary value moment of the app within the first session. Every percentage point improvement in this metric directly improves Day 7 and Day 30 retention, reducing the acquisition spend required to maintain a given active user count.
Q2 focus: Habit formation and session depth.
Once activation is working, the Q2 focus shifts to habit formation. Session frequency by user cohort reveals whether the app is becoming a daily or weekly habit or remains an occasional utility. Apps that fail to form habits at this stage will show strong Day 1 and Day 7 retention that collapses between Day 7 and Day 30, the most common retention profile and the one that indicates a product that is useful but not yet habitual.
Q3 focus: Monetization efficiency.
With activation and habit formation working, Q3 is where the P&L becomes genuinely legible. ARPU, LTV by cohort, and contribution margin are now measurable against targets that were set with real-world performance data rather than projections. The Q3 question is whether the monetization model is extracting the commercial value that the retention performance justifies, or whether there is a conversion step between habitual use and revenue that is underperforming.
Q4 focus: Acquisition efficiency and scale.
The P&L model’s most powerful capability is acquisition efficiency: knowing the LTV of each user cohort with enough precision to make informed decisions about how much to pay to acquire the next one. The enterprises that have operated the P&L model for a full year enter Q4 with a CAC:LTV ratio that is both accurate and actionable. They know which acquisition channels produce the highest LTV users, which onboarding variants convert at the highest rate, and what contribution margin justifies what acquisition investment. That knowledge is a competitive advantage that the project model never produces.
What the Data Says About the Performance Gap Between P&L and Project Models
The performance differential between apps managed as P&Ls and apps managed as projects is visible in every commercial metric that matters.
Successful apps generate up to $3 for every $1 spent on development and marketing on average (Guarana Technologies, citing 2024 ROI research). The average ROI for an enterprise mobile app deployment is estimated at 35 percent within the first two years (Wifitalents, enterprise mobile app statistics, February 2026). 62 percent of businesses report higher customer satisfaction after investing in UI and UX for their mobile apps (Wifitalents, 2026). Subscription apps post Day 30 retention near 14 percent, more than 2.5 times the cross-category mean, driven by paywall design and personalized onboarding (Digital Applied, April 2026). Yearly subscription plans retain 44.1 percent of users versus 17 percent for monthly plans, demonstrating that the monetization model is itself a retention mechanism when designed correctly (App Verticals, March 2026).
These outcomes are not distributed randomly across the enterprise mobile landscape. They are concentrated in organizations where someone owns the commercial performance of the app and has the authority to make the decisions that drive it.
The Mobile App P&L Performance Benchmark Table:
Metric | Project Model Typical Outcome | P&L Model Top Quartile Outcome | Source |
Day 30 retention | 2 to 4% (cross-category median) | 10 to 18% (productivity and fintech) | UXCam, April 2026 |
Day 1 retention | 20 to 26% average | 28 to 33% top quartile | Adjust, AppsFlyer, 2026 |
Subscription annual retention | 17% monthly plan average | 44.1% yearly plan | App Verticals, March 2026 |
Average ROI on deployment | Below target at 2 years | 35% within 2 years | Wifitalents, 2026 |
Customer satisfaction post UX investment | No structured investment | 62% report improvement | Wifitalents, 2026 |
Revenue per $1 development spend | Below 1x (project overhead) | Up to $3 per $1 spent | Guarana Technologies, 2024 |
How Should a CTO or CPO Transition From the Project Model to the P&L Model?
The transition from project to P&L is not a single decision. It is a sequenced organizational change that requires specific actions in a specific order.
Step 1: Assign a named P&L owner before the next planning cycle. The single most impactful organizational change is creating the role and filling it with someone who has both commercial credibility and product authority. Without a named owner, every other structural change produces measurement without accountability.
Step 2: Define the P&L before defining the roadmap. The next planning cycle for the mobile app should begin with a P&L definition: what are the revenue or value contribution targets, what is the cost structure, and what contribution margin represents success? That definition frames every subsequent roadmap conversation.
Step 3: Instrument the full funnel before making roadmap commitments. The P&L model requires data that most enterprise mobile teams do not currently have: full-funnel visibility from acquisition source through activation, habit formation, monetization, and retention by cohort. Building that instrumentation is a prerequisite for the P&L model, not a nice-to-have that follows it.
Step 4: Restructure the quarterly review. Replace the technology status update with a business performance review. The agenda items are: P&L performance against target, retention cohort analysis, LTV by acquisition source, contribution margin trend, and specific roadmap investments addressing the performance gaps the data reveals.
Step 5: Fund the app as a business unit, not a project. Replace the project budget model with a continuous investment model tied to P&L performance. When the app exceeds contribution margin targets, investment increases. When it misses targets, the review focuses on diagnosis and remediation rather than cost reduction.
The Compounding Advantage of Getting This Right Early
The P&L model compounds. An organization that builds mobile P&L discipline in year one has better data in year two, makes better decisions in year two, generates better commercial outcomes in year two, and attracts the investment and talent that those outcomes justify. An organization that remains in the project model in year one repeats the same cycle: build, launch, maintain, rebuild.
The mobile app market is projected to grow by $2.63 trillion between 2025 and 2029 (Yahoo Finance, via Wezom, September 2025). The enterprises that capture a disproportionate share of that growth will be the ones that treated mobile as a revenue-generating business unit while their competitors were still arguing about delivery timelines.
The model is not complicated. Name an owner. Define a P&L. Instrument the funnel. Review the business quarterly. Fund growth based on what the data says the unit is worth.
The enterprises that have done this are not winning because they have better engineers or bigger budgets. They are winning because they are making better decisions with better data, and the compounding effect of that advantage becomes harder to close with every quarter that passes.
The Conversation That Separates the Leaders From the Laggards
The conversation that separates the mobile leaders from the laggards is not about technology. It is about accountability.
Ask the person responsible for your enterprise mobile app these questions: What is the contribution margin of the app this quarter? What is the Day 30 retention rate and how does it compare to last quarter’s cohort? What is the LTV of a user acquired from your highest-performing channel? What specific roadmap investment is expected to produce the largest improvement in the metric most limiting commercial performance right now?
If those questions produce clear, data-supported answers, your organization is operating the P&L model. If they produce a feature list and a delivery timeline, you are operating the project model, and the gap between those two answers is the gap between the commercial performance you have and the commercial performance the mobile channel could be generating.
If your enterprise mobile app is being managed as a project and you want to understand what it would deliver as a P&L, schedule a consultation with our team. We will map your current performance against P&L model benchmarks, identify the specific gaps in accountability, instrumentation, and roadmap focus that are limiting commercial performance, and build a transition roadmap that converts your mobile investment into a business unit that compounds.