
 iOS App Development
 Android App Development
 React Native
 Flutter
 Web Development
 Custom Software
 Front End Development
 Blockchain Development
 Virtual Reality
 Cloud Computing
 IoT Development
 Augmented Reality
 Write us a message
The board does not care about ticket resolution times. It does not care about patch compliance rates or mean time to detect. It cares about three things: financial risk, competitive position, and capital efficiency. If your business case for managed IT services is built around IT metrics, it will not survive the first question from the CFO. If it is built around those three things, with IT as the mechanism rather than the subject, it will.
This is the guide for building that case. Not a general argument for managed IT. A structured, board-ready business case with the financial models, the formulae, the comparison frameworks, and the risk quantification that turns a technology recommendation into a capital allocation decision that the board can evaluate, approve, and measure.
The organizations that build this case well are the ones that get the budget. The ones that present IT as a cost to be minimized discover, usually too late, that the board agreed with their framing.
Why Most IT Business Cases Fail at Board Level
Before building the case correctly, it is worth understanding precisely why most IT business cases fail. The failure is almost never factual. The technology is usually right, the vendor is usually qualified, and the financial benefits are usually real. The failure is structural: the case is built in the language of IT and presented to people who think in the language of business.
The most common mistake CIOs make is comparing the managed services fee to the visible IT headcount cost (Transputec, IT Budget 2026, 2026). That comparison produces a number that appears unfavorable, because the managed services fee is visible and the true cost of the alternative is mostly hidden. The board sees the fee and compares it to a salary, when the correct comparison is the fee against the total cost of ownership of in-house IT, including the costs that never appear on a single line item.
The second most common failure is leading with capability rather than consequence. A business case that leads with “24/7 monitoring and endpoint detection and response” is a technology specification. A business case that leads with “the current model exposes the organization to a $3.31 million average breach event against which we have no adequate defense, and the managed IT investment reduces that probability by an estimated 55 percent” is a risk management decision. Those two framings produce different responses in a boardroom.
The third failure is presenting a single scenario rather than a decision framework. Boards make decisions between alternatives, not decisions to approve or reject a single option. A business case that presents managed IT without modeling the cost of the status quo and the cost of building equivalent capability internally is a case that leaves the board without the comparison it needs to make a confident decision.
The framework that follows addresses all three failures.
Step 1: Build the True Cost of Ownership Model for the Status Quo
The starting point of any board-ready business case is an accurate picture of what the current state actually costs. Not the headcount cost. The total cost of ownership.
The most common mistake in this analysis is comparing the managed services fee to the visible IT headcount cost. The correct comparison is total cost of ownership (TCO) (Transputec, 2026). TCO includes every cost the current model generates, including the ones that are distributed across multiple budget lines and therefore invisible in any single report.
The Complete In-House IT TCO Framework:
Cost Category | What It Includes | Typical Annual Impact |
Base compensation | Salary for all IT roles | Full salary per FTE |
Benefits and employer taxes | Health, pension, NI/Social Security, ~43% of wages | 43% of base salary per FTE (BLS ECEC, June 2026) |
Recruitment and replacement | Job board, recruiter fees, interview time, onboarding | 150-200% of annual salary per replacement (industry research) |
Training and certifications | Ongoing professional development, certification fees | $3,000-$8,000 per IT staff member per year |
Security tooling | EDR, SIEM, RMM, backup, awareness training at retail pricing | $15,000-$40,000+ annually depending on user count |
Downtime cost | Revenue loss, productivity loss during incidents | $300,000+ per hour for 93% of organizations (ITIC 2024-2025) |
Cyber incident cost | Breach response, forensics, notification, legal | $3.31M average for businesses under 500 employees (IBM 2025) |
Compliance gaps | Audit findings, remediation, potential penalties | $15,000-$50,000 per compliance engagement (StationX, 2026) |
Opportunity cost | Strategic IT work deferred while team handles reactive operations | Unquantified but material |
For a 75-employee company with one internal IT hire, verified three-year TCO research places the in-house model at $633,996 over three years versus $461,338 for managed IT, a difference of $172,658 over the period, before breach avoidance and downtime reduction value is applied (BSG Tech, Total Cost of Ownership Research, July 2026, using BLS ECEC June 2026 compensation data and BLS OEWS May 2025 salary data).
The formula for building your organization’s specific TCO is:
In-House IT TCO = (Base Salaries + Benefits at 43% + Recruitment Cost + Training) + Security Tooling + Expected Downtime Cost + Expected Breach Cost + Compliance Remediation Cost
Where Expected Downtime Cost = (Annual Downtime Hours) x (Revenue Per Hour + Productivity Cost Per Hour)
And Expected Breach Cost = (Breach Probability) x (Average Breach Cost for your organization size)
That formula produces a number that almost always surprises the leadership team building the case, because it makes visible costs that were never previously aggregated into a single figure.
Step 2: Build the Managed IT TCO for Direct Comparison
Once the status quo TCO is established, the managed IT TCO must be built with equal completeness. The managed IT side of the comparison is typically underestimated in one direction: organizations forget to include the costs that remain on their side of the engagement even after the MSP is engaged.
Managed IT Full TCO Components:
Cost Category | Typical Range | Notes |
Managed services fee | $100-$175 per user per month (fully managed) | Sagiss, MSP Statistics 2026 |
Co-managed fee | $50-$100 per user per month | Sagiss, 2026 |
Internal liaison time | 10-20% of one FTE | Oversight, escalations, vendor relationship |
Transition and onboarding | One-time cost, typically 1-2 months of service fee | First-year only |
Hardware (if not included) | Varies by scope | Clarify what is in and out of scope |
Residual in-house costs | Any retained internal IT roles | Count these fully |
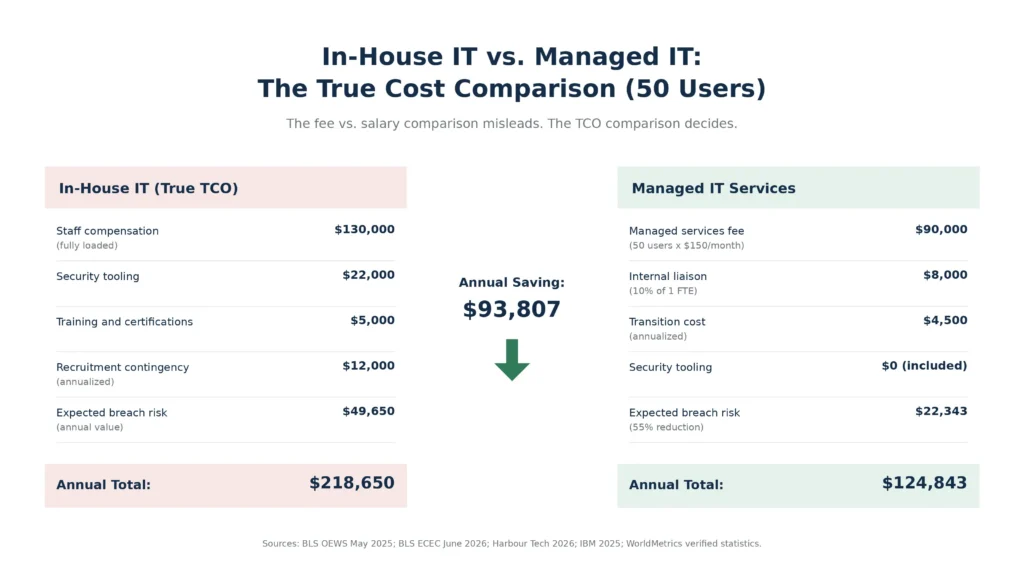
For a 50-person organization at $150 per user per month, the annual managed IT cost is $90,000 before internal liaison time. Compare this to the fully-loaded in-house equivalent for a single competent IT hire, which runs $95,000 to $145,000 per year in base plus benefits, tools, and training, before any breach risk or downtime cost is applied (Harbour Tech, In-House IT vs Managed IT Services Cost Comparison, 2026). The managed services option for a 50-person company typically costs roughly $77,000 less per year while delivering substantially more capability, and that comparison is before the risk reduction value is applied (Harbour Tech, 2026).
The Side-by-Side TCO Comparison Model:
Cost Item | In-House IT (50 users) | Managed IT (50 users at $150/user/month) |
IT staff compensation (fully loaded) | $130,000 | $0 (included in service) |
Security tooling | $22,000 | $0 (included in service) |
Training and certifications | $5,000 | $0 (included in service) |
Recruitment contingency (annualized) | $12,000 | $0 |
Managed services fee | $0 | $90,000 |
Internal liaison (10% of 1 FTE at $80K) | $0 | $8,000 |
Subtotal before risk costs | $169,000 | $98,000 |
Expected downtime cost differential | Baseline | Save 85% of current downtime cost |
Expected breach cost differential | Baseline | 55% reduction in incident rate |
Total advantage of managed IT | Baseline | ~$71,000 direct + risk reduction value |
Sources: Salary data from BLS OEWS May 2025. Security tooling estimates from Atlantic Computer Systems ROI of Outsourcing IT 2026. Downtime reduction from Zero1.com TCO Framework, 2026. Incident rate reduction from WorldMetrics managed services statistics.
Step 3: Quantify the Risk Reduction Value
This is the section of the business case that most organizations underinvest in building, and it is frequently the section that determines whether the board approves the investment. The TCO comparison shows cost efficiency. The risk reduction section shows risk management. Both are necessary. For most boards, the risk reduction section carries more weight.
Risk reduction value has three components that must be separately calculated and presented.
Component A: Breach Probability Reduction
The average data breach cost for businesses with fewer than 500 employees is $3.31 million (IBM Cost of a Data Breach Report, 2025, via Deepstrike). Managed services reduce security incidents by an average of 55 percent (WorldMetrics, Managed Services Statistics, verified). Organizations with understaffed security face breach costs $1.76 million higher than well-staffed peers (IBM, 2025).
The formula for annual breach risk value:
Annual Breach Risk Value = Breach Probability x Average Breach Cost x Incident Rate Reduction
Example for a 150-person company:
- Estimated annual breach probability without managed security: 15 percent (conservative estimate based on 81% of SMBs experiencing incidents in 12 months per ITRC 2025, adjusted for organization size)
- Average breach cost: $3.31 million
- Incident rate reduction from managed IT: 55 percent
- Annual breach risk value = 0.15 x $3,310,000 x 0.55 = $272,925
That $272,925 is the expected annual value of breach prevention. It is not a certainty. It is the probability-weighted financial benefit of the risk reduction, expressed in the language boards use for all risk management decisions.
Component B: Downtime Cost Reduction
Businesses experience up to 85 percent less downtime with managed services compared to in-house IT (Zero1, TCO Framework for Enterprises, 2026). Managed service providers reduce unplanned downtime by as much as 78 percent (Terminal B, Managed IT Services ROI Guide). The average downtime cost is $8,662 per hour for smaller organizations (Terminal B, 2026), rising to $300,000 or more per hour for 93 percent of midsize and large organizations (ITIC 2024-2025).
Downtime Reduction Value = (Current Annual Downtime Hours) x (Hourly Downtime Cost) x (Downtime Reduction Percentage)
Example for an organization currently experiencing 15 hours of unplanned downtime annually at $50,000 per hour cost:
- Current annual downtime cost: 15 x $50,000 = $750,000
- Reduction with managed IT at 78 percent: $750,000 x 0.78 = $585,000 annual value
Component C: Cyber Insurance Premium Impact
This is a frequently overlooked but financially significant component of the risk reduction case. Cyber insurance premiums are increasingly tied to demonstrable security posture. Organizations with managed security services, continuous monitoring, and documented incident response plans qualify for lower premiums and higher coverage limits than those without.
The cost of compliance for a small business, between $15,000 and $50,000 annually, is far less than the $3.31 million average SMB breach cost (StationX, Cybersecurity Spending Statistics, 2026). The insurance dimension means that the managed IT investment does not just reduce the probability of the cost. It reduces the cost of the insurance against the cost, which is a compounding benefit that belongs in the board presentation.
Total Risk Reduction Value = Breach Risk Value + Downtime Reduction Value + Insurance Premium Reduction
Step 4: Build the Three-Scenario Financial Model
Boards make better decisions when they can evaluate a range of outcomes rather than a single projection. A business case that presents one set of numbers invites the board to debate whether those numbers are right. A business case that presents three scenarios, conservative, base case, and optimistic, invites the board to discuss which scenario best reflects their organization’s situation and to make a risk-informed decision.
The Three-Scenario Model for Managed IT ROI:
Financial Variable | Conservative | Base Case | Optimistic | Sources |
IT cost reduction | 15% | 28% | 40% | WorldMetrics (28% avg TCO reduction); Research range 15-45% |
Downtime reduction | 50% | 78% | 85% | Terminal B (78%); Zero1 (85%) |
Security incident reduction | 35% | 55% | 70% | WorldMetrics (55% avg) |
Time to positive ROI | 18 months | 12 months | 6 months | 82% positive ROI within 12 months (WorldMetrics) |
3-year ROI | 150% | 250% | 350%+ | Terminal B (150-300%); IDC 2025 (350%) |
The ROI Formula:
ROI = ((Total Benefits – Total Costs) / Total Costs) x 100
Where Total Benefits = IT Cost Savings + Downtime Reduction Value + Breach Risk Reduction Value + Insurance Premium Reduction + Productivity Gains
And Total Costs = Managed Services Fee + Internal Liaison Cost + Transition Cost
The Payback Period Formula:
Payback Period = Total Investment Cost / Annual Net Benefit
Example calculation for a 100-person organization:
- Annual managed IT cost: $180,000 (at $150 per user per month)
- Annual IT cost savings vs status quo: $65,000
- Annual downtime reduction value: $85,000
- Annual breach risk reduction value: $120,000
- Total annual benefit: $270,000
- Net annual benefit: $270,000 – $180,000 = $90,000
- Payback period: $180,000 / $90,000 = 2.0 years
- 3-year ROI: (($270,000 x 3) – ($180,000 x 3)) / ($180,000 x 3) x 100 = 50% 3-year ROI (conservative scenario)
In the base case and optimistic scenarios, where breach avoidance and full downtime reduction value are included, this same organization achieves 3-year ROI between 150 and 300 percent (Terminal B, 2026).
Step 5: Build the Productivity and Strategic Capacity Case
The financial model captures the cost efficiency and risk reduction dimensions of the managed IT case. There is a third dimension that belongs in a board presentation: the strategic capacity that managed IT creates by freeing the organization’s internal people from IT firefighting.
Managed IT services reduce IT operational costs by an average of 30 percent while AI-assisted service delivery among leading MSPs delivers 15 to 25 percent improvement in technician productivity and 40 to 70 percent reduction in ticket resolution times (Omdia 2026 MSP Trends and Predictions, cited by Sagiss, 2026). 58 percent of SMBs say managed IT services are cost-effective, and 37 percent say working with an MSP has saved their organization money (JumpCloud, via Sagiss, 2026).
But the productivity case that matters most to a board is not the efficiency of the IT function itself. It is the productivity returned to every other function in the organization when IT stops being a friction point.
Employees who spend time waiting for IT support, working around system failures, managing their own security anxieties, or being interrupted by IT incidents are employees whose productive capacity is being taxed by IT management failures. That tax is invisible because it never appears on an IT report. Making it visible is one of the most powerful elements of a board business case.
The Productivity Tax Quantification:
Productivity Impact | Estimate | Calculation Basis |
Average IT tickets per employee per year | 8-12 | Industry helpdesk benchmarks |
Average time lost per ticket (wait + resolution) | 2-4 hours | HDI benchmarks |
Employee fully loaded hourly cost | $40-$100 depending on role | BLS OEWS and benefits data |
Annual productivity cost per 100 employees at low estimate | 100 x 8 x 2 x $40 = $64,000 | Conservative |
Annual productivity cost per 100 employees at high estimate | 100 x 12 x 4 x $100 = $480,000 | For knowledge worker-heavy organizations |
Reduction with managed IT (45-65% ticket reduction) | $29,000-$312,000 | HDI 2025 data via VGICS Global |
Even at the conservative end of this range, the productivity case adds material value to the board presentation. At the upper end, for organizations with high concentrations of knowledge workers where IT friction is a daily productivity cost, it is the largest single financial benefit in the entire case.
Step 6: Address the Objections Before They Are Raised
A board presentation that anticipates and addresses objections before the board raises them demonstrates analytical rigor and builds confidence. The managed IT business case has a predictable set of objections that appear in nearly every boardroom.
Objection 1: “The monthly fee looks expensive compared to what we pay now.”
Response framework: The comparison the board is making is fee versus salary. The correct comparison is fee versus total cost of ownership. Present the TCO model from Step 1 and Step 2 side by side. For most organizations under 150 employees, the in-house versus managed IT decision is not primarily a cost decision: the cost analysis almost always favors managed services for businesses under 150 employees (Unlocking Tech, In-House IT vs Managed IT Services, 2026).
Objection 2: “We would lose control of our IT environment.”
Response framework: Define what control means operationally. If control means visibility and governance, managed IT typically provides more of it, through documented configurations, SLA-governed performance reporting, and real-time dashboards that most in-house IT operations do not produce. If control means the ability to make technology decisions independently, the managed IT agreement governs that: a well-structured agreement specifies decision rights explicitly. Present the SLA and governance framework alongside the financial model.
Objection 3: “What happens if we need to switch providers?”
Response framework: This is a legitimate risk that belongs in the business case, not a reason to reject it. Address it directly: the transition risk is real, manageable, and substantially lower than the operational risk of the status quo. Present the contractual protections that govern data portability, documentation handover, and transition support. A managed IT agreement with strong exit provisions gives the board more leverage over the relationship than an internal IT team whose institutional knowledge is not documented anywhere.
Objection 4: “Can we trust an external provider with our sensitive data?”
Response framework: The security case is, counterintuitively, the strongest argument for managed IT rather than the strongest argument against it. Present the security capability comparison: what the current in-house model provides versus what a qualified MSP provides. The average MSP security posture, including 24/7 SOC coverage, enterprise-grade EDR, and continuous vulnerability management, is not achievable at equivalent cost through an internal team in a market with 4.7 million unfilled cybersecurity roles (ISC2, 2024).
Objection 5: “This is not the right time given budget pressures.”
Response framework: Present the cost of inaction explicitly. This is the dimension most business cases omit, and it is frequently decisive. The board is not choosing between managed IT and a neutral status quo. It is choosing between managed IT and the financial exposure of the current state. Frame it as a decision between a known, predictable investment and an unknown, unpredictable exposure: an expected annual breach risk value of $272,925 for the example organization above, plus the expected downtime cost, plus the accumulated compliance exposure.
Step 7: The Cost of Inaction Model
The cost of inaction is the most powerful section of a board-level business case because it converts the managed IT decision from an investment question, which the board can defer, into a risk management question, which the board cannot.
The Cost of Inaction Framework:
Risk Category | Annual Expected Cost (Current State) | Probability | Expected Annual Value |
Cybersecurity breach | $3.31M average (IBM 2025) | 15% for 150-person org (ITRC 2025 adjusted) | $496,500 |
Unplanned downtime | $50,000-$300,000 per hour | 15 hours average unplanned downtime | $750,000-$4.5M |
Compliance failure | $15,000-$50,000 per engagement | Annual exposure for non-compliant controls | $30,000 |
Talent departure risk | 150-200% of salary per replacement | 20% annual IT staff turnover industry rate | $30,000-$60,000 per departure |
Strategic IT debt | Engineering time on maintenance vs. innovation | Ongoing | $64,000-$480,000 productivity cost |
The cost of inaction formula:
Annual Cost of Inaction = Expected Breach Cost + Expected Downtime Cost + Compliance Exposure + Talent Risk Cost + Productivity Cost
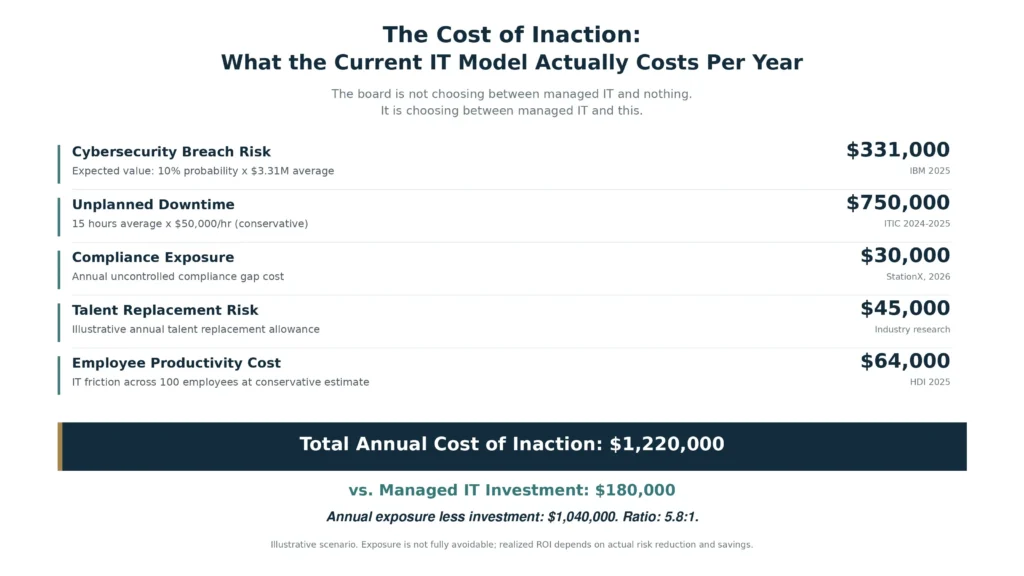
For a 100-person organization using conservative estimates:
Expected breach cost: 0.10 x $3,310,000 = $331,000
Expected downtime cost: 15 hours x $50,000 = $750,000 (using low-end estimate)
Compliance exposure: $30,000
Talent risk: $45,000
Productivity cost: $64,000
Total annual cost of inaction: $1,220,000
Against a managed IT investment of $180,000 annually, the expected annual value of the investment is $1,220,000 minus $180,000 = $1,040,000 net annual value, a 5.8:1 return on investment using conservative assumptions.
That is the number that belongs on the opening slide of the board presentation.
The Board Presentation Structure
Once the financial model is built, the presentation structure determines how effectively it lands. A board presentation for managed IT should follow the same structure as any capital allocation decision: problem, cost of inaction, solution, financial model, risk mitigation, governance, and recommendation.
The Seven-Section Board Presentation Structure:
Section 1: Executive Summary (One Slide)
Three sentences: the current IT risk exposure in financial terms, the managed IT solution and its primary mechanism of value, and the expected financial outcome. Lead with the risk, not the technology.
Section 2: Current State Assessment (One to Two Slides)
The TCO of the current IT model compared against the board’s visible cost perception. Make the hidden costs visible. Include the breach probability, the downtime exposure, and the compliance gaps. This section reframes the board’s mental model of what the current state costs before the investment is presented.
Section 3: The Cost of Inaction (One Slide)
The annual expected value of all risks the current model carries, expressed as a single number. This is the most persuasive slide in the deck because it converts the investment decision into a risk management decision.
Section 4: The Managed IT Solution (One Slide)
A concise description of what managed IT delivers, framed around the risks identified in Section 3. Not a capability list. A risk mitigation map: here is the risk, here is how managed IT addresses it.
Section 5: The Three-Scenario Financial Model (One to Two Slides)
Conservative, base case, and optimistic scenarios with TCO comparison, ROI, and payback period for each. Present the source of each assumption. Boards trust models whose assumptions are visible.
Section 6: Vendor and Governance Framework (One Slide)
Who will provide the service, how performance will be governed, what SLAs apply, and what exit provisions protect the organization. Address the control and trust objections proactively.
Section 7: Recommendation and Decision Required (One Slide)
A specific recommendation with a decision timeline. Not “we recommend evaluating managed IT” but “we recommend approving the managed IT engagement with Provider X at $X per month, commencing Q3, with the expected outcomes described in the base case scenario.”
The One-Page Business Case Template
For organizations that need to distribute the business case before the board meeting, a one-page summary that carries the essential financial argument without requiring the recipient to have attended the full presentation is essential.
Structure:
The Problem: Our current IT model costs an estimated $[TCO] annually when fully loaded, carries an estimated $[cost of inaction] in annual expected risk exposure, and provides [X] hours of coverage with [Y] security capability level.
The Solution: Managed IT services from [Provider] at $[annual cost], delivering [core capability summary] with [SLA commitments].
The Financial Case: Base case scenario projects $[annual benefit] in combined savings, downtime reduction, and breach risk reduction, against $[annual cost], producing a [payback period] payback and [ROI] three-year ROI.
The Cost of Inaction: Every quarter without managed IT carries an estimated $[quarterly cost of inaction] in expected risk exposure that the current budget does not provision for.
The Decision Required: Board approval of $[annual investment] to engage [Provider] from [start date], with a 12-month review against the base case financial model.
What the Board Needs to See in the First 90 Seconds
Every board presentation has a make-or-break moment in the first 90 seconds where the board either leans in or starts checking their phones. For managed IT, that moment is determined by whether the opening statement sounds like a technology pitch or a financial argument.
Sounds like a technology pitch (loses the board):
“We are proposing to engage a managed service provider to deliver 24/7 monitoring, endpoint protection, and helpdesk support.”
Sounds like a financial argument (earns the room):
“Our current IT model carries an estimated $1.2 million in annual expected risk exposure against which we have no contractual protection, at a total cost of ownership that is $77,000 per year higher than the managed alternative we are proposing. The decision before the board today is whether to convert that exposure into a predictable, governed investment that reduces our expected annual IT risk by approximately $800,000.”
The technology is the mechanism. The financial argument is the case. Build the case in the language of the board, and the technology will be approved on its merits.
If your organization is building the business case for managed IT and you want a financial model calibrated to your specific headcount, risk profile, and current IT operating cost, schedule a consultation with our team. We will build the TCO comparison, the risk quantification, and the three-scenario financial model that your board needs to make a confident decision, grounded in your actual numbers rather than industry averages.