 iOS App Development
 Android App Development
 React Native
 Flutter
 Web Development
 Custom Software
 Front End Development
 Blockchain Development
 Virtual Reality
 Cloud Computing
 IoT Development
 Augmented Reality
 Write us a message
Adding a new system to your application ecosystem feels like progress. You are solving a problem. Closing a capability gap. Giving a team the tool they asked for. The purchase order is signed, the implementation kicks off, and the roadmap moves forward.
What the roadmap does not show is what that addition costs the systems already running.
Every new application you connect to your ecosystem does not simply add its own weight. It multiplies the complexity of everything it touches. The connections required between systems do not grow linearly with the number of systems. They grow quadratically. The formula is n(n-1)/2, where n is the number of systems requiring integration (Wikipedia, Enterprise Application Integration; Stacksync, Integration Complexity Research, December 2025). A company running five integrated systems maintains ten integration connections. Add a fifth system and you need ten. Add a tenth system and you need 45. Add a twentieth and you need 190. That is not a linear cost. It is a structural tax that compounds with every addition and is paid in engineering time, system fragility, and operational risk every single day.
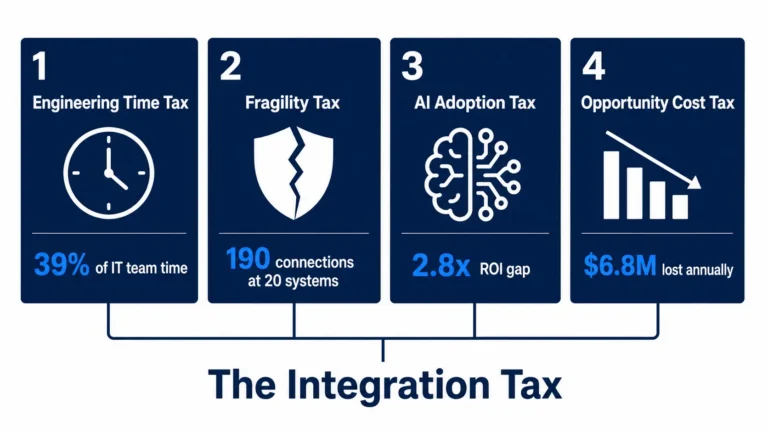
This is the integration tax. And most organizations are paying it without ever having calculated what it costs.
The numbers from primary research are unambiguous. Organizations average 897 applications, with 45 percent reporting they use 1,000 or more, yet only 28 percent of those applications are integrated (MuleSoft 2025 Connectivity Benchmark Report, surveying 1,050 IT leaders globally). 83 percent of IT leaders report that integration challenges are slowing their organization’s progress (MuleSoft 2025 Connectivity Benchmark Report). Integration challenges cost organizations an average of $6.8 million annually in lost productivity and delayed projects (MuleSoft 2025 Connectivity Benchmark Report). 95 percent of IT leaders report integration as a direct hurdle to implementing AI effectively (MuleSoft 2025 Connectivity Benchmark Report). IT teams spend 39 percent of their time creating and maintaining custom integrations, time that is structurally unavailable for feature development, security improvements, or strategic technology work (MuleSoft 2025 Connectivity Benchmark Report).
The integration tax is not a future problem. It is accumulating in your codebase right now, in every point-to-point connection your engineering team built to keep two systems talking, in every custom API adapter holding together a workflow no one fully documented, in every data pipeline that breaks silently when an upstream vendor changes a field name without notice.
The Math That Explains Why Your Ecosystem Gets Harder to Manage Every Year
The reason integration complexity feels inexorable is because it is, mathematically, under a point-to-point architecture. Understanding the formula is not an academic exercise. It is the foundation for every architectural and procurement decision your organization makes.
In a point-to-point integration architecture, every system that needs to exchange data with every other system requires its own dedicated connection. Each connection has its own authentication model, its own data schema mapping, its own error handling logic, and its own maintenance burden. When you add a new system, you are not adding one integration. You are adding one integration for every existing system that needs to communicate with the new one.
The Integration Complexity Table:
Systems in Ecosystem | Point-to-Point Connections Required | New Connections Added by Last System |
5 | 10 | 4 |
10 | 45 | 9 |
15 | 105 | 14 |
20 | 190 | 19 |
50 | 1,225 | 49 |
100 | 4,950 | 99 |
Source: Mathematical formula n(n-1)/2, verified by Stacksync Integration Complexity Research (December 2025) and Wikipedia’s Enterprise Application Integration article.
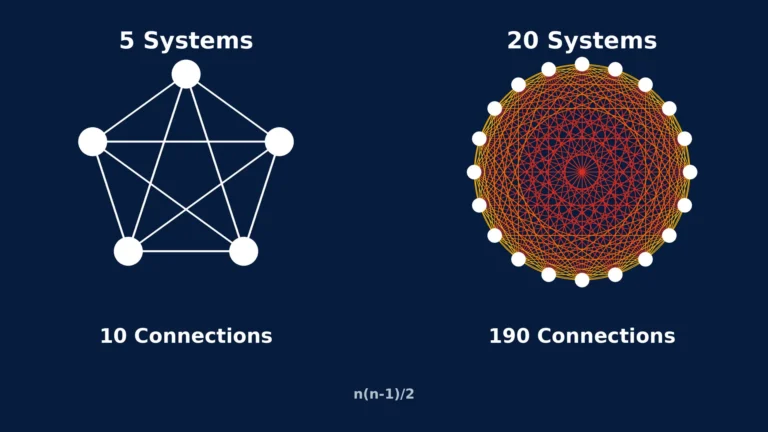
The organization running 20 integrated systems is not managing 20 integrations. It is managing 190. Each of those 190 connections is a potential point of failure. Each has its own version dependency. Each breaks independently when either connected system changes. Each requires engineering attention to monitor, maintain, and repair.
Organizations report crossing critical thresholds where integration maintenance begins consuming more time than new feature development. Data engineering teams spend the majority of their time addressing integration failures, updating connectors for API changes, and troubleshooting synchronization issues, leaving minimal capacity for strategic initiatives (Stacksync, December 2025). This is not an organizational dysfunction. It is the mathematical consequence of a point-to-point architecture reaching a complexity threshold it was never designed to survive.
What the Integration Tax Actually Looks Like in Practice
The integration tax is paid across four dimensions simultaneously. Understanding each one separately is what makes the total cost visible.
Dimension 1: The Engineering Time Tax
39 percent of IT team time is spent creating and maintaining custom integrations (MuleSoft 2025 Connectivity Benchmark Report). For an engineering team of 20 developers at a fully loaded cost of $150 per hour, that represents approximately $4.7 million in annual engineering capacity consumed by integration work rather than product development.
That figure is not hypothetical. It precisely matches what organizations report spending to build out custom integrations: an average of $4.7 million on custom integration development (MuleSoft 2023 Connectivity Benchmark Report, cited by IT Pro Today). The cost of building integrations and the cost of maintaining them are two separate bills. Most organizations are paying both.
78 percent of engineering teams face challenges with data orchestration and tool complexity, with data pipeline development alone taking up to 12 weeks per pipeline (Informatica 2024 Report, via Integrate.io). 79 percent have undocumented data pipelines, and 57 percent report that business needs change before integration requests are even fulfilled (Informatica 2024 Report). The engineering team is not slow. The architecture is generating more maintenance work than the team can execute while simultaneously meeting delivery commitments.
The Engineering Time Tax in numbers:
| Engineering Team Size | Time Spent on Integration Maintenance (39%) | Annual Cost at $150/hr Fully Loaded | Time Available for Product Development |
|---|---|---|---|
| 10 developers | 3.9 FTE equivalent | $1.2M | 6.1 FTE equivalent |
| 20 developers | 7.8 FTE equivalent | $2.4M | 12.2 FTE equivalent |
| 50 developers | 19.5 FTE equivalent | $6.1M | 30.5 FTE equivalent |
| 100 developers | 39 FTE equivalent | $12.2M | 61 FTE equivalent |
Source: MuleSoft 2025 Connectivity Benchmark Report (39% figure). Cost calculations use $150/hr fully loaded rate as a conservative industry benchmark.
Dimension 2: The Fragility Tax
Every integration is a dependency. Every dependency is a potential failure. In a point-to-point architecture, a schema change in one system potentially breaks multiple downstream integrations simultaneously (Stacksync, December 2025). The more integrations exist, the more systems can be affected by a single upstream change, and the harder it becomes to predict the blast radius of any modification to any system in the ecosystem.
This is not a theoretical risk. The CrowdStrike Falcon Sensor update on July 19, 2024 crashed 8.5 million Windows machines, grounded 7,000 flights, and wiped out $5.4 billion overnight (Technical Debt Strategic Guide 2025, citing the verified public incident record). The AWS October 2025 outage began with a DNS failure in US-East-1 that propagated through DynamoDB, Lambda, EC2, IAM, and routing gateways over 15 hours, affecting hundreds of thousands of businesses simultaneously (SoftwareSeni, Infrastructure Outages and Cloud Reliability 2025). The Cloudflare November 2025 outage, triggered by a ClickHouse database configuration exceeding memory limits, cascaded to affect 28 percent of global HTTP traffic (same source).
These are the most visible manifestations of what happens when tightly coupled, highly integrated systems fail. But the same cascading failure mechanism operates at a smaller scale inside every enterprise application ecosystem with a high density of point-to-point integrations. A vendor updates their API. The field name changes from customer_id to customerId. Every integration that reads that field breaks simultaneously, silently, in production, until a downstream report shows unexpected nulls or a transaction fails and triggers an alert.
Silent failures deserve specific attention because they are the most damaging category of integration failure. Unlike a system outage that generates immediate alerts, a silent integration failure produces bad data that flows undetected through downstream systems. Reports become unreliable. Decisions are made on incorrect information. Compliance controls receive inaccurate inputs. By the time the failure is discovered, the corrupted data has propagated through multiple systems and the remediation scope has expanded dramatically beyond what immediate detection would have required. As one analysis framed it precisely: the cost of skipping integration maintenance does not show up in a single outage. It appears gradually, in reports that slowly become less trustworthy, until someone finally questions the numbers (UC Today, March 2026).
Dimension 3: The AI Adoption Tax
This is the integration tax’s most consequential current impact, and the one with the largest forward-looking cost.
95 percent of IT leaders report integration as a direct hurdle to implementing AI effectively (MuleSoft 2025 Connectivity Benchmark Report). 80 percent of organizations say data silos, the direct consequence of poor integration, are the biggest barrier to achieving automation and AI goals (MuleSoft 2025 Connectivity Benchmark Report). Companies with strong integration achieve 10.3 times ROI from AI initiatives versus 3.7 times for those with poor connectivity (MuleSoft 2025 Connectivity Benchmark Report, via Integrate.io 2026).
The relationship between integration quality and AI return is not marginal. It is a 2.8 times ROI multiplier. AI systems require data. The quality, completeness, and timeliness of the data they receive determines the quality of the outputs they generate. When that data flows through fragmented, partially integrated, inconsistently maintained integration layers, the AI’s output inherits every flaw in the data infrastructure beneath it.
64 percent of organizations cite integration complexity as a top barrier to scaling AI adoption (World Quality Report 2025, OpenText and Capgemini, November 2025, surveying organizations globally). 80 percent of data scientists’ time is spent preparing and cleaning data rather than analyzing it, a direct consequence of integration gaps that force manual data preparation before any analytical work can begin (Informatica 2024 Report, via Integrate.io 2026).
The organization investing in AI on top of a fragmented integration architecture is not transforming. It is digitizing the dysfunction at a higher cost.
Integration Quality vs. AI ROI:
| Integration Maturity | AI Initiative ROI | Relative Performance |
|---|---|---|
| Strong integration | 10.3x ROI | Baseline high |
| Poor connectivity | 3.7x ROI | 64% lower than strong integration |
Source: MuleSoft 2025 Connectivity Benchmark Report, via Integrate.io 2026.
Dimension 4: The Opportunity Cost Tax
The $6.8 million average annual cost of integration challenges reported by organizations in the MuleSoft 2025 Connectivity Benchmark Report is the direct cost: the engineering time, the delayed projects, the incident response, the remediation work. The opportunity cost is structurally larger and almost never quantified.
57 percent of integration requests are not fulfilled before business requirements change (Informatica 2024 Report). That means more than half of all integration work initiated by business teams either delivers late, delivers to outdated requirements, or is abandoned entirely. The business capability that integration was supposed to enable is not built. The competitive response that depended on the integrated data flow does not happen. The AI initiative that required the connected data environment stays on the roadmap.
The system integration market reached $410.25 billion in 2024, projected to grow to $932.66 billion by 2032 (Fortune Business Insights, via Albato State of Integrations Report 2025). Organizations are not reducing their integration investment. They are increasing it. The question is whether that investment is going toward a scalable integration architecture or toward the maintenance of an expanding point-to-point mesh that becomes progressively more expensive to manage and progressively more fragile to operate.
The Five Specific Ways New Systems Compound Ecosystem Fragility
1. Version Dependency Proliferation
Every integration carries version dependencies on both sides. The integration between your CRM and your data warehouse was built against CRM version 4.2 and data warehouse schema version 3.1. When either system updates, the integration may break, may produce incorrect results, or may silently continue operating while mapping fields that no longer mean what they meant when the integration was built.
Vendors update their APIs regularly. Notices do not always reach every organization that built something on top of those APIs. Even when they do, the timeline is not always enough for stretched engineering teams (UC Today, March 2026). Each new system added to the ecosystem adds a new version dependency timeline to manage. As system count grows, the probability that at least one dependency is out of compliance with a recent update at any given moment approaches certainty.
The BizTalk example is illustrative: organizations still running Microsoft BizTalk, which reaches end-of-life in 2028, face migration of hundreds or thousands of integrations. Many discover their BizTalk implementations have become so complex and so poorly documented that migration has become a massive undertaking requiring years of planning (Frends, Integration Debt Research, November 2025). The integration debt accumulated over years of adding systems without architectural governance is now the primary obstacle to the modernization those systems were supposed to enable.
2. Data Schema Drift and Inconsistency
When multiple systems maintain separate representations of the same data object, those representations diverge over time. The customer record in your CRM has a different structure than the customer record in your ERP, which differs from the customer record in your billing system, which differs again from the representation in your analytics platform. Each integration that synchronizes these representations makes an assumption about equivalence that is technically wrong and becomes more wrong with every system update.
The practical consequence is that cross-system reporting becomes unreliable, and the unreliability grows with the number of systems involved. A revenue report that pulls data from three systems may show three different revenue figures depending on which system’s definition of recognized revenue is used and when the last synchronization occurred. The report is not wrong by accident. It is wrong by architecture.
79 percent of organizations have undocumented data pipelines (Informatica 2024 Report). When a pipeline is undocumented, the data schema assumptions embedded in it are invisible until they break. And when they break, the debugging process requires reverse-engineering what the original developer intended, under the time pressure of a failed production pipeline.
3. Security Surface Expansion
Every integration point is a potential attack vector. Every API credential managing system-to-system communication is a credential that can be compromised. Every data flow between systems is a pathway through which data can be exfiltrated if the integration is not properly secured.
Organizations that fail compliance audits experience a 31 percent breach rate versus only 3 percent among compliant businesses (Gartner 2024 prediction, via Integrate.io 2026). The compliance dimension of integration security is frequently neglected: organizations that implement new integrations without reviewing their impact on compliance control boundaries, data residency requirements, and access governance create compliance debt that accumulates with every addition.
48 percent of organizations lack a complete list of all third parties with access to their network (Ponemon Institute research). In an organization running 897 applications with 28 percent integration coverage, the third-party access profile is effectively unmappable through manual processes. Each integration that was implemented without proper security review, that uses shared credentials, that lacks logging and monitoring, represents a persistent security gap that grows more difficult to close as the ecosystem complexity grows.
4. Incident Blast Radius Growth
In a tightly integrated ecosystem, the blast radius of any single failure is determined by how many systems depend on the failing component. As integration density increases, the blast radius of any individual failure grows. A system that was originally connected to three others has a blast radius of three when it fails. A system that has been progressively integrated with fifteen others has a blast radius of fifteen.
Integration complexity creates interdependencies where failures cascade across connected systems. A schema change in one system potentially breaks multiple downstream integrations simultaneously (Stacksync, December 2025). The AWS October 2025 outage demonstrated this at infrastructure scale: a DNS failure propagated through five core services over 15 hours, affecting hundreds of thousands of organizations. The same cascade mechanism operates at application layer within any enterprise ecosystem where integration governance has not kept pace with integration growth.
5. Engineering Cognitive Load Accumulation
This failure mode is rarely measured and almost never discussed in architectural reviews, but it is among the most consequential. Engineering teams operating in highly integrated, poorly documented ecosystems carry an ever-growing cognitive load of understanding how systems interact, which integrations are fragile, which modifications are safe, and which changes carry hidden downstream consequences.
That cognitive load has a direct productivity cost and a talent consequence. Engineers working in architecturally complex, poorly integrated environments spend disproportionate time understanding existing systems rather than building new capabilities. Developers who could be shipping features are instead decoding the implications of a proposed change on 47 downstream integrations they cannot fully map. The most capable engineers, who have the most options, leave environments where they spend more time navigating integration debt than building meaningful systems. A single dependency or outdated integration can cascade into system-wide failure, stalling the business when it matters most. Enterprise engineers are hired to build new platforms or drive automation, but they spend sprint after sprint debugging fragile connections instead (Technical Debt Strategic Guide, Eluminous Technologies, October 2025).
The Three Architectural Postures and What Each Costs
Not all organizations pay the integration tax equally. The architectural posture an organization adopts determines how severely complexity compounds as the system count grows.
Posture 1: Point-to-Point (Most Common, Highest Tax)
Each system connects directly to every other system it needs to communicate with. Complexity grows quadratically with system count per the n(n-1)/2 formula. This is the architecture most organizations end up with through organic growth and decentralized procurement, not through deliberate choice.
Cost profile: Highest engineering maintenance burden, highest fragility, highest incident blast radius, worst AI readiness, fastest complexity accumulation per new system added.
Posture 2: Hub-and-Spoke or ESB (Common, Moderate Tax)
A central integration broker or Enterprise Service Bus mediates communication between systems. Each system connects to the hub rather than to every other system, reducing connection count. Complexity grows linearly rather than quadratically.
Cost profile: Reduced maintenance burden compared to point-to-point, but the hub itself becomes a single point of failure and a bottleneck. Hub modernization or replacement becomes an enormous undertaking as it accumulates integrations over time.
Posture 3: API-First with Event-Driven Architecture (Least Common, Lowest Tax)
Systems publish events and expose APIs through a common governance framework. Consumers subscribe to the data they need rather than relying on custom point-to-point connections. The complexity of adding a new system approaches linear growth, and the coupling between systems is explicit, versioned, and governed.
Cost profile: Highest upfront design investment, lowest ongoing maintenance burden, highest AI readiness, most resilient failure isolation, best scalability economics.
Architectural Posture Comparison:
Dimension | Point-to-Point | Hub-and-Spoke | API-First Event-Driven |
Complexity growth | Quadratic n(n-1)/2 | Linear | Near-linear |
Connections at 20 systems | 190 | 20 | 20 governed interfaces |
Failure blast radius | High and growing | Hub-dependent | Isolated and contained |
AI data readiness | Low | Moderate | High |
Engineering maintenance burden | Very high | Moderate | Low after initial investment |
New system addition cost | Very high | Moderate | Low |
What the Integration Tax Costs the Business, Beyond Engineering
The engineering cost of the integration tax is the most visible component. The business cost is larger and less frequently quantified in the same conversation.
Decision velocity. Organizations where data flows cleanly across integrated systems make decisions faster than those where cross-system data requires manual consolidation, reconciliation, or approximation. When a revenue report requires three days of data preparation because four systems each maintain different versions of the same metric, the decision that report informs is a decision made on stale, approximate data. That decision quality gap compounds across every significant business decision made in a year.
Digital transformation delivery. McKinsey estimates that integration and data complexity adds 10 to 20 percent to every technology project budget (cited in Technical Debt Strategic Guide, October 2025). For an organization running a $10 million digital transformation program, that represents $1 to $2 million in costs directly attributable to the complexity of integrating new capabilities into an existing ecosystem. Integration complexity was cited as the top barrier to digital transformation by 64 percent of respondents in the World Quality Report 2025.
Competitive velocity. Feature development velocity in a high-integration-debt environment is measurably slower than in a well-architected one. When engineering teams spend 39 percent of their time on integration maintenance, the 61 percent available for feature development is what determines how fast the product moves. A competitor with a well-governed integration architecture and an engineering team spending 15 percent of time on integration maintenance has effectively 25 percent more product development velocity from the same headcount.
AI initiative ROI. The 10.3 times versus 3.7 times AI ROI differential between organizations with strong and poor integration is the most financially material consequence of the integration tax in 2025 and 2026. As AI becomes a primary competitive differentiator, the integration architecture beneath AI initiatives determines whether those initiatives return 10 times or 3.7 times. That 2.8 times multiplier applied to a $5 million AI program is a $14 million difference in realized return. The integration architecture is not a supporting concern to AI strategy. It is a determinant of AI strategy outcomes.
The Governance Failure That Turns Integration Growth Into Integration Debt
Understanding why organizations accumulate integration debt despite understanding its consequences requires examining the governance failure that produces it.
Integration debt does not accumulate because engineering teams make bad decisions. It accumulates because purchasing decisions and architectural decisions are made in separate processes, by separate people, with separate incentive structures, and without shared visibility into the compounding cost of each addition.
A business unit leader evaluating a new SaaS platform sees the platform’s capabilities against their business requirements. They do not see the integration surface area the platform will create, the point-to-point connections that will need to be built to connect it to existing systems, the data schema assumptions that will need to be managed, or the security review that should precede any data flow involving that platform.
61.3 percent of organizations admit their automation tools are underutilized due to fragmented strategies and siloed implementations (Enterprise Automation Index, via Albato State of Integrations Report 2025). 80 percent of data silos, the primary source of AI adoption failure, are the direct consequence of applications procured without integration governance (MuleSoft 2025 Connectivity Benchmark Report). The fragmentation is not a technical failure. It is a governance failure that manifests technically.
The organizations that manage integration complexity most effectively share one common characteristic: they have established integration as a strategic concern with architectural governance, not as an IT implementation detail managed after procurement decisions are made.
The Governance Framework That Stops Integration Tax From Compounding
The goal is not to stop adding systems. Modern enterprises require diverse, specialized tools, and the right systems genuinely create value. The goal is to stop adding systems in ways that compound fragility without accounting for the integration cost those additions impose.
Pre-procurement integration impact assessment. Before any new system is approved for procurement, a documented assessment of its integration requirements, data schema implications, security surface additions, and maintenance burden should be a condition of approval. This is not a veto mechanism. It is a cost transparency mechanism that ensures the integration tax is visible to the decision-maker before the purchase order is signed.
Integration architecture ownership. Designate explicit ownership of integration architecture at the level of a principal engineer or enterprise architect whose accountability includes the health of the overall integration ecosystem, not just individual integration projects. When no one owns the ecosystem, no one is accountable for the cumulative complexity that individual decisions create.
API-first as a procurement standard. New systems that cannot expose data through documented, versioned APIs, or that require proprietary integration methods, impose a higher integration tax than systems built on open API standards. Making API quality a procurement criterion directly reduces the integration tax per system added.
Integration observability as a production requirement. Every integration in production should be monitored for health, latency, error rates, and data quality. Silent failures, the most expensive category of integration failure, are only silent when monitoring is absent. Integration observability converts silent failures into detected failures, reducing the time between failure occurrence and remediation.
Documented integration inventory. 79 percent of organizations have undocumented data pipelines (Informatica 2024 Report). An integration that is not documented is an integration that cannot be safely modified, cannot be reliably audited, and cannot be efficiently debugged when it fails. Maintaining a current, accurate integration inventory is not documentation overhead. It is operational infrastructure.
Architectural review for complexity-reducing patterns. When integration maintenance reaches the threshold where it consumes more engineering time than feature development, the correct response is not more integration tooling. It is an architectural transition toward patterns that reduce the connection count: event-driven architectures that decouple producers from consumers, API management layers that abstract point-to-point complexity, and shared data layers that eliminate the need for bilateral synchronization between every pair of systems that shares data.
The Inflection Point: When Integration Debt Becomes the Primary Business Constraint
There is a point in the growth trajectory of every complex application ecosystem where integration debt transitions from an engineering concern to a business constraint. It is the point where the complexity of the existing integration layer makes new capability additions slower than the market requires, where the fragility of the ecosystem makes risk-taking on new systems prohibitively dangerous, and where the data quality degradation from integration gaps has made organizational decision-making materially less reliable.
Organizations approaching that point typically exhibit recognizable symptoms: feature delivery timelines that keep extending despite stable headcount, post-mortems that consistently identify integration failures as root causes, AI initiatives that consistently underperform their projected returns, business unit complaints that IT cannot keep pace with market requirements, and engineering leadership conversations that return repeatedly to the question of whether to build something new on top of the existing architecture or invest in addressing the architecture itself.
When those symptoms are present together, the integration tax is no longer a maintenance cost. It is a growth constraint. And the cost of addressing it, always significant, is lower before it reaches that threshold than after.
The $6.8 million in average annual integration cost that organizations report does not capture the revenue not generated, the AI returns not realized, the features not shipped, and the decisions made on degraded data (MuleSoft 2025 Connectivity Benchmark Report). Those costs are real. They are just distributed across the P&L in ways that never appear on the integration line item.
The Decision That Determines Your Next Three Years
Every system procurement decision your organization makes in the next quarter is also an integration architecture decision, whether or not it is framed that way.
The CRM upgrade is an integration decision. The data warehouse migration is an integration decision. The new HR platform, the customer analytics tool, the third-party payment processor, the AI platform your leadership team approved last month: each one is adding to the n in your n(n-1)/2 equation. Each one is incrementing the integration tax your engineering team pays every sprint. Each one is either being managed under an integration governance framework that keeps the complexity accountable, or it is being absorbed into an expanding point-to-point mesh that becomes progressively more expensive to operate and progressively more dangerous to modify.
The organizations that will win on product velocity, AI ROI, and operational resilience over the next three years are not necessarily the ones with the most systems. They are the ones whose systems talk to each other cleanly, whose data flows are documented and governed, whose integration architecture was built for the scale they are operating at rather than the scale they were at five systems ago.
The integration tax is not optional. Every ecosystem pays it. The variable is whether your organization is paying it knowingly, with an architecture designed to minimize it, or unknowingly, with a complexity that compounds unchecked until it becomes the primary constraint on every ambition your business has.
If your engineering team is spending more time maintaining integrations than building the product, the architecture conversation is overdue. Schedule a consultation with our team. We will map your current integration surface area, quantify the complexity and fragility cost your ecosystem is carrying, and build a prioritized roadmap for reducing the integration tax before it becomes the ceiling on your next phase of growth.