 iOS App Development
 Android App Development
 React Native
 Flutter
 Web Development
 Custom Software
 Front End Development
 Blockchain Development
 Virtual Reality
 Cloud Computing
 IoT Development
 Augmented Reality
 Write us a message
Most CTOs believe they know what is inside their systems. They know the architecture decisions that were made three years ago. They know which parts of the codebase the team avoids. They know which integrations are fragile and which legacy components are overdue for replacement. They carry a mental model of technical risk that is accurate in broad strokes and dangerously incomplete in the details that matter most.
A technical audit does not confirm what you already know. It finds what you do not.
The gap between those two things is where the most expensive problems live. The open source vulnerability that has been sitting in production since a developer added a jQuery dependency in 2021. The cloud misconfiguration that has been exposing a storage bucket to the public internet for seven months without triggering an alert. The technical debt that has quietly consumed 40 percent of the engineering budget without appearing on any roadmap or board presentation. The compliance control that was documented during the last audit and has since drifted to a state that would not survive the next one.
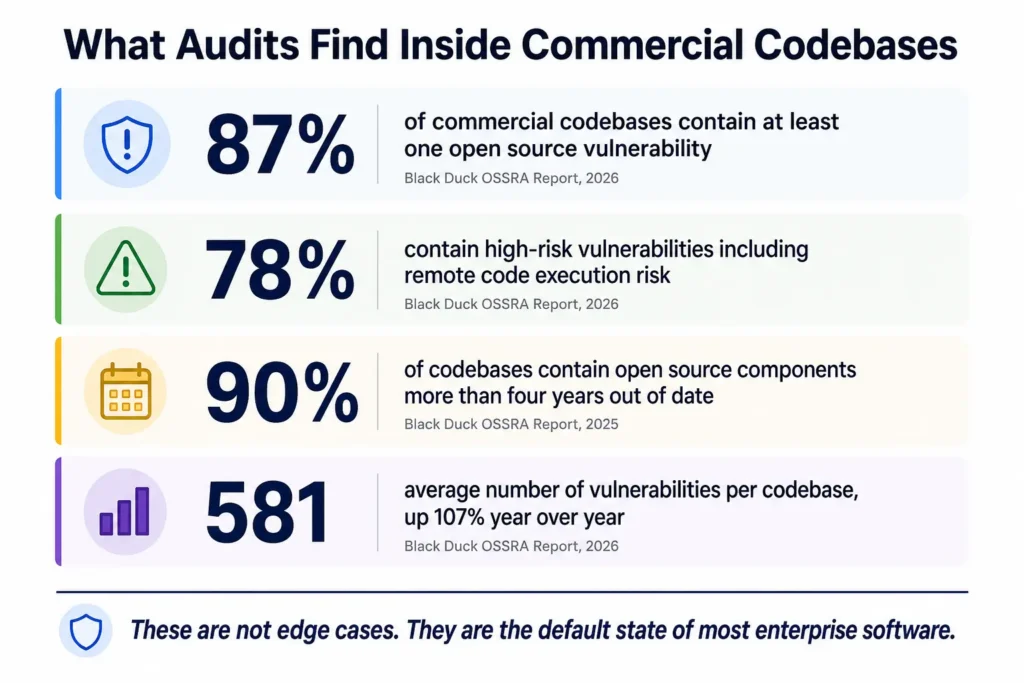
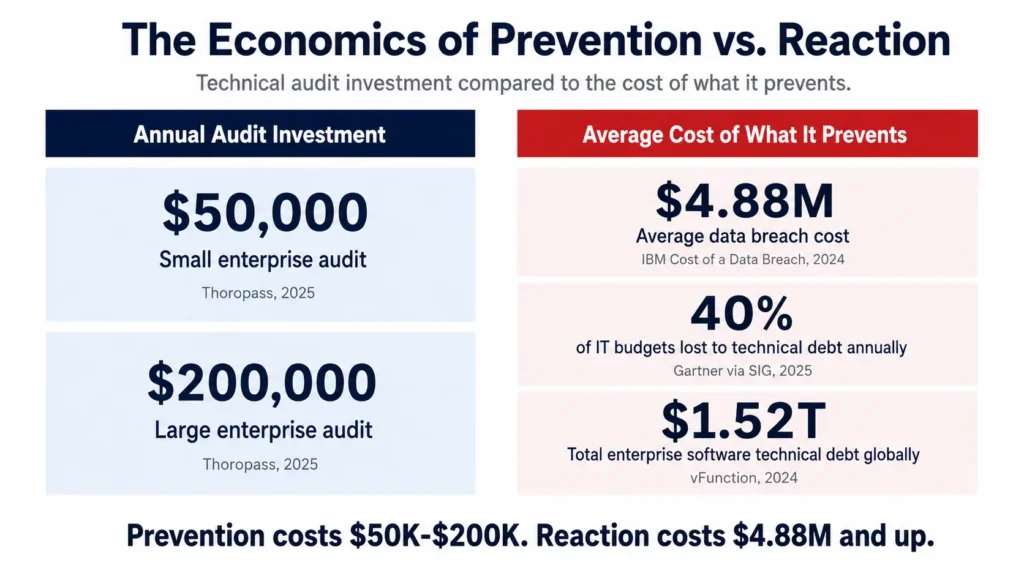
The data on what audits actually find is not reassuring. 87 percent of all audited commercial codebases contain at least one open source vulnerability, with 78 percent containing high-risk vulnerabilities and 44 percent containing critical-risk vulnerabilities that could lead to remote code execution or significant data breaches (Black Duck 2026 OSSRA Report, auditing 947 codebases across 17 industries). The average number of open source vulnerabilities per codebase more than doubled year-over-year, rising 107 percent to an average of 581 vulnerabilities per codebase (Black Duck 2026 OSSRA Report). Technical debt consumes up to 40 percent of IT budgets in organizations with significant legacy systems (Gartner, via SIG research and multiple 2025 and 2026 sources). 80 percent of technical debt will be architectural by 2026 (Gartner, via SIG). 74 percent of breaches include a human factor, with phishing and social engineering exploiting exactly the kinds of access control gaps that technical audits consistently surface (Verizon DBIR 2024). And the average cost of a data breach reached $4.88 million in 2024, compared to annual audit investments of $50,000 to $200,000 for most enterprise organizations (IBM Cost of a Data Breach Report 2024, Thoropass 2025).
The audit is not the cost. The audit is what prevents the cost.
What a Technical Audit Actually Is, and What It Is Not
Before examining what audits find, the scope of the term requires precision. Technical audit is used loosely to describe exercises ranging from a brief security scan to a comprehensive multi-week assessment of code quality, architecture, security posture, compliance controls, and infrastructure configuration. For this piece, a technical audit means the comprehensive version: a structured, expert-led evaluation of an organization’s technology environment that produces documented findings, quantified risk, and a prioritized remediation roadmap.
That definition excludes two things that are commonly confused with technical audits.
It excludes automated scanning. Vulnerability scanners, static analysis tools, and cloud security posture management platforms are valuable components of a security program. They are not audits. They find what they are configured to look for. They do not understand the business context of what they find, they do not assess whether controls are operating as documented, and they do not identify the architectural or governance failures that produce vulnerabilities rather than cataloging the vulnerabilities themselves.
It excludes compliance certification assessments. A SOC 2 assessment, a PCI-DSS audit, or an ISO 27001 certification review evaluates whether a specific set of controls exist and are documented. It does not evaluate whether those controls are actually operating effectively in your environment, whether they are sufficient for your specific risk profile, or whether the gaps outside the certification scope represent material risk. Organizations that pass compliance certifications while carrying significant technical debt and security exposure are common. The certification boundary and the actual risk boundary are rarely identical.
A genuine technical audit covers the territory that falls between automated scanning and compliance certification: the expert human judgment about what is actually in the environment, how it actually operates, where the real risk lives, and what needs to change.
The Seven Categories of Findings That Technical Audits Consistently Reveal
1. Open Source Vulnerability Exposure That Most Organizations Have Never Fully Mapped
Modern application development is built on open source. 97 percent of all audited codebases contain open source components, with the average application containing 911 distinct open source components (Black Duck 2025 OSSRA Report, auditing 965 commercial codebases). The number of open source files in an average application has tripled since 2020, from 5,386 to 16,082 (Black Duck 2025 OSSRA Report).
The security consequence of that dependency density is severe and consistently underestimated. 87 percent of commercial codebases contain at least one open source vulnerability (Black Duck 2026 OSSRA Report). 90 percent of audited codebases contain open source components more than four years out of date (Black Duck 2025 OSSRA Report). 64 percent of open source components in audited applications are transitive dependencies: components that are present because they are dependencies of other dependencies, not because any developer chose to include them directly (Black Duck 2025 OSSRA Report). These transitive dependencies are the ones most likely to be unmonitored, undocumented, and unaddressed when vulnerabilities are disclosed.
The most prevalent high-risk vulnerability found in audits is CVE-2020-11023, an XSS vulnerability in outdated versions of jQuery, still present in one-third of all scanned codebases despite being disclosed in 2020 (Black Duck 2025 OSSRA Report). That statistic captures the fundamental problem: vulnerabilities that are known, documented, and fixable persist in production environments because no one has done the work to find and address them systematically.
Technical audits surface this exposure completely, mapping every open source component in the application estate, its version, its known vulnerabilities, its license obligations, and its update status. Organizations that have never conducted this mapping routinely discover that their actual open source vulnerability exposure is orders of magnitude larger than what their automated scanning suggested.
What open source audits additionally reveal:
- License conflicts that create legal and IP exposure. 68 percent of audited codebases in 2026 contain open source license conflicts, the largest year-over-year increase in the history of the OSSRA report, partly driven by AI-generated code that incorporates GPL-licensed components without retaining license information (Black Duck 2026 OSSRA Report)
- Software Bill of Materials gaps that prevent the organization from responding effectively to newly disclosed vulnerabilities because they do not know which applications are affected
- Supply chain attack exposure. 65 percent of organizations experienced a software supply chain attack in the past year (Black Duck 2026 OSSRA Report)
2. Technical Debt Concentration and Its Hidden Cost Profile
Technical debt is one of the most universally acknowledged and least precisely understood problems in enterprise software. Every engineering organization knows it has technical debt. Very few have ever quantified where it is concentrated, what it is actually costing, and which portions represent genuine risk versus acceptable accumulated complexity.
Technical debt accounts for 40 percent of IT balance sheets, with CIOs estimating it represents 20 to 40 percent of their entire technology estate value (McKinsey, via multiple 2025 sources). 51 percent of companies dedicate more than a quarter of their total annual IT budget to technical debt remediation (vFunction, 2024 survey of technology executives). Companies that address technical debt systematically achieve 20 to 40 percent productivity gains, and organizations implementing strategic debt reduction frameworks have eliminated over 665 applications and platforms, reducing their enterprise landscape by nearly 30 percent (McKinsey, via ByteIota, December 2025).
The most damaging category is architectural technical debt, which accounts for 80 percent of all technical debt by 2026 (Gartner, via SIG). Architectural debt is not a collection of bad functions or poorly named variables. It is the structural complexity of systems that were never designed for their current scale, the circular dependencies between components that make modification impossible without risk, the monolithic architectures that cannot be tested in isolation, the data models that were right for 2019 requirements and are wrong for 2025 ones. This is the debt that blocks the most important engineering work because it cannot be addressed incrementally: it requires architectural rethinking that demands time, expertise, and organizational commitment that reactive engineering cycles never provide.
A technical audit maps this debt precisely. It identifies which components carry the highest architectural debt, quantifies the maintenance cost of carrying that debt forward, and produces a prioritized remediation roadmap that distinguishes between debt that can be serviced gradually and debt that is actively constraining the organization’s most important capabilities.
The technical debt cost profile that audits surface:
Technical Debt Category | Typical Finding | Business Consequence |
Architectural debt | Circular dependencies, monolithic structures unable to scale | Blocks modernization, constrains AI adoption, creates cascading failure risk |
Dependency debt | Outdated libraries, unsupported frameworks, EOL runtime versions | Security vulnerability exposure, compatibility failure under updates |
Documentation debt | Undocumented systems, tribal knowledge dependencies, absent runbooks | Single point of failure, engineering onboarding drag, incident response delays |
Test coverage debt | Untested critical paths, absent integration tests, manual regression processes | Feature delivery risk, inability to refactor safely, deployment frequency constraints |
Configuration debt | Inconsistent environments, undocumented infrastructure decisions, drift between dev and production | Deployment failures, environment-specific bugs, compliance control gaps |
Sources: McKinsey technical debt research, Gartner via SIG, vFunction 2024 survey.
3. Security Posture Gaps That Compliance Certifications Did Not Catch
This is consistently the finding that produces the most significant organizational recalibration when a technical audit is completed. Organizations that passed their last compliance certification assessment frequently discover, through a technical audit, that their actual security posture differs materially from what the certification implied.
The gap exists because compliance certifications evaluate whether controls exist and are documented. Technical audits evaluate whether controls are actually operating effectively across the real environment, including the parts of the environment that were added since the last certification assessment, the integrations that were not in scope for the certification, and the configurations that have drifted since the controls were last validated.
Over 48,000 new CVEs were published in 2025, roughly 131 per day (AppSecSanta, April 2026). Attackers move from initial entry to lateral spread in an average of 48 minutes (CrowdStrike and ReliaQuest research, cited by Elisity, November 2025). The window between a vulnerability being disclosed and it being exploited in the wild is shrinking consistently. Organizations that are managing their security posture through annual certification cycles rather than continuous assessment are operating on a detection and remediation timeline that does not match the speed of the threat environment.
The specific security gaps that technical audits most commonly find:
Cloud misconfigurations remain the leading cause of cloud-related breaches, with IAM policy gaps, overly permissive S3 bucket permissions, and container security misconfigurations among the most frequent findings (IT Security Audit Methodology guide, Qualysec, March 2026). Cloud identities were found to be 99 percent over-permissioned in one large-sample investigation (DeepStrike, cybersecurity statistics 2025 to 2026). 40 percent of Microsoft vulnerabilities in 2024 allowed for elevation of privilege, meaning that any users or service accounts operating with local administrator rights represent immediately exploitable access paths (BeyondTrust Microsoft Vulnerabilities Report 2025, via The Hacker News).
The human layer is equally significant. More than 74 percent of breaches include a human factor (Verizon DBIR 2024). Technical audits that include social engineering assessments consistently demonstrate that the most sophisticated technical controls can be bypassed through phishing campaigns that exploit the access of legitimate users, particularly in environments where privileged access management has not been tightly governed.
4. Infrastructure and Architecture Scalability Constraints
Growing organizations frequently discover through audits that their infrastructure was designed for a previous scale and has not been architecturally updated to support the one they are operating at. The performance problems, the occasional inexplicable outages, and the delivery delays that the engineering team attributes to complexity are frequently the symptoms of architectural constraints that were never surfaced and formally addressed.
A technical audit that includes infrastructure and architecture review maps the current-state architecture against the organization’s three-year growth trajectory and identifies the specific constraints that will become operational failures rather than merely performance concerns as scale increases. This includes database architecture that cannot support projected transaction volumes without re-platforming, network topology that creates single points of failure that the organization has not recognized as such, cloud architecture that was designed for development workloads and is running production loads without the redundancy, monitoring, and failover architecture that production requirements demand, and API design patterns that were acceptable at current integration density and will become bottlenecks as the integration footprint grows.
5. Compliance Drift Since the Last Formal Assessment
Compliance posture is not static. It degrades with every system change, every new integration, every new team member who joins without completing security training, and every configuration update that was not reviewed against compliance requirements before being deployed.
47 percent of organizations have failed a formal audit two to five times in the past three years (Coalfire, 2024). 85 percent of companies report that compliance has become more complex over the past three years (Sprinto, 2025). The compliance gaps found in failed audits are almost never the result of deliberate non-compliance. They are the result of environments that changed faster than compliance governance tracked them, producing drift between the documented control posture and the actual operating environment.
Technical audits conducted before year-end are particularly valuable for compliance drift assessment because they produce findings and remediation time before the next formal audit cycle begins. The organization that discovers compliance gaps in its own technical audit has time to remediate them. The organization that discovers them during a regulatory assessment is remediating under penalty exposure, with constrained timeline and maximum organizational disruption.
The compliance drift categories that technical audits consistently find:
- Access control drift: users with permissions that exceed their current role requirements, service accounts with broader access than their function requires, and former employees or contractors with credentials that were not fully deprovisioned
- Configuration drift: security settings that were correct at the last assessment and have since changed, either through deliberate updates that were not compliance-reviewed or through automated processes that overrode manual configurations
- Documentation drift: policies and procedures that describe controls as they operated when they were written but do not reflect how the environment currently operates
- Scope drift: new systems, integrations, and data flows that were added since the last compliance assessment and were not formally reviewed against applicable framework requirements
6. Third-Party and Supply Chain Risk That Is Invisible Without Active Assessment
The 2024 CrowdStrike incident demonstrated at global scale what was already well documented in security research: the most catastrophic risk to enterprise systems frequently does not originate within the enterprise. It originates in the software, infrastructure, and services that the enterprise depends on, and manifests when a trusted component fails or is compromised.
65 percent of organizations experienced a software supply chain attack in the past year (Black Duck 2026 OSSRA Report). The average enterprise has hundreds of third-party software dependencies, dozens of SaaS platforms processing organizational data, and multiple managed service relationships with privileged access to production environments. The security and compliance posture of all of those relationships is part of the organization’s effective security posture, whether the organization has assessed it or not.
Technical audits that include third-party and supply chain assessment map these dependencies systematically, identify which third parties have access to what data and systems, evaluate the contractual and technical protections governing those relationships, and identify the gaps between what the organization’s compliance obligations require of its third parties and what those third parties can currently demonstrate.
7. Performance and Reliability Gaps With Direct Revenue Consequences
The final category of technical audit findings is the one with the most immediately quantifiable business consequence: the performance and reliability gaps that are directly costing the organization revenue or competitive position without being visible on any internal report.
The relationship between application performance and revenue is well established. A one-second page load delay reduces conversions by 7 percent (verified across multiple 2025 and 2026 sources). Application crashes cause 62 percent of affected users to uninstall (industry research). Legacy systems with below-average architecture deliver updates 40 percent slower than those with modern architecture (Software Improvement Group, Finance Signals 2025). Technical audits that include performance and reliability assessment surface the specific architectural and infrastructure decisions that are producing suboptimal performance, along with quantified estimates of the revenue impact of closing identified gaps.
This is the finding category that most directly translates audit investment into board-level ROI narrative: here is what the current architecture is costing in conversion terms, here is what the specific remediation would require, and here is the revenue that closing that gap would recover.
The Year-End Timing Argument
The recommendation to commission a technical audit before year-end is not arbitrary. It reflects four specific factors that make the final quarter of the year the highest-value timing window for this investment.
Budget planning input. Technical audit findings produce a prioritized, quantified remediation roadmap. That roadmap needs to be in front of planning teams before next year’s technology budget is finalized, not after commitments have been made to initiatives that may not reflect the actual highest-priority investments the audit would have identified. An audit completed in Q4 informs Q1 planning. An audit completed in Q1 confirms what the budget has already committed to.
Compliance calendar alignment. Most regulatory frameworks require annual assessments, and many organizations align their compliance calendar to the fiscal year. A technical audit completed before year-end produces findings and remediation evidence that can be incorporated into year-end compliance reporting, and identifies any gaps with enough time to address them before the formal assessment cycle begins.
Year-end security posture review. The final quarter is when most organizations conduct strategic technology reviews. Having current, expert-validated data about the actual state of the technology environment, rather than a mental model built from engineering team assessments and automated scanning output, changes the quality of every strategic conversation in that review cycle.
Vendor and contract renewal alignment. Many technology contracts and managed services agreements renew on calendar-year cycles. Technical audit findings about which systems require investment, which relationships are not delivering value, and which capabilities have gaps that existing vendors are not addressing are most actionable when they arrive before renewal decisions are made, not after another year of commitment has been locked in.
What the Audit Investment Actually Costs Against What It Prevents
The economics of technical audits are clear when the numbers are examined honestly.
The Technical Audit ROI Model:
Scenario | Cost | Compared To |
Annual audit investment (enterprise) | $50,000 to $200,000 (Thoropass, 2025) | $4.88M average breach cost (IBM 2024) |
Prevention vs. remediation ratio | 1x prevention cost | 24x to 97x reactive cost |
Vulnerability discovered in audit | Days to weeks to fix | Same vulnerability discovered after breach: $4.88M+ |
Compliance gap found in own audit | Remediation on own timeline | Same gap found in regulatory audit: Fines, penalties, deal risk |
Technical debt quantified early | Managed reduction at 15-20% of budget | Unmanaged debt reaching crisis: Emergency remediation at 2-3x cost |
Architecture constraint found pre-crisis | Planned investment | Architecture failure at scale: Revenue loss plus emergency rearchitecture |
Sources: IBM Cost of a Data Breach Report 2024, Thoropass 2025, McKinsey technical debt research.
The cybersecurity audit return on investment is demonstrable: audits prevent costly breaches by identifying vulnerabilities proactively, with the average data breach costing $4.88 million compared to annual audit investments of $50,000 to $200,000 (Thoropass, 2025, citing IBM 2024). That 24x to 97x return on prevention investment does not require heroic assumptions about breach probability. It requires only that the audit finds one vulnerability that would otherwise have been exploited, one compliance gap that would otherwise have produced regulatory action, or one architectural constraint whose early identification avoids a much more expensive emergency.
What a Well-Structured Technical Audit Covers
Not all technical audits are equivalent. The value of the exercise depends on the scope of what is assessed, the expertise of who conducts it, and the quality of the output that translates findings into actionable organizational intelligence.
A comprehensive technical audit for an enterprise organization should cover:
Codebase assessment. Static analysis of application code for vulnerability patterns, dependency analysis mapping all open source components against known vulnerability databases, code quality evaluation against maintainability and testability standards, and documentation assessment identifying tribal knowledge dependencies and gaps.
Infrastructure and cloud configuration review. Assessment of cloud environment configurations against security benchmarks (CIS Controls, cloud provider security baselines), IAM policy review for over-permissioned accounts and roles, network architecture review for segmentation and exposure gaps, and container and serverless security configuration assessment.
Architecture review. Evaluation of current-state architecture against scalability, resilience, and maintainability requirements, technical debt mapping with quantified cost and prioritized remediation sequencing, and assessment of the architecture’s readiness for the organization’s planned growth and technology initiatives.
Security posture assessment. Penetration testing of external and internal attack surfaces, social engineering assessment of the human layer, incident response capability evaluation, and security operations maturity assessment.
Compliance controls assessment. Evaluation of controls against applicable frameworks including SOC 2, HIPAA, PCI-DSS, GDPR, and CMMC, identification of control gaps and compliance drift since the last formal assessment, and documentation review for accuracy against current operating environment.
Third-party and supply chain assessment. Inventory of third-party software dependencies and their security posture, assessment of SaaS platforms against data handling and security requirements, and managed service relationship review against access governance and compliance obligations.
What the Output Should Produce
The output of a technical audit is only as valuable as the organizational decisions it enables. A findings report that lives in a shared drive without producing budget decisions, remediation commitments, or strategic plan adjustments is an expensive document.
A well-structured technical audit output includes:
An executive summary that translates technical findings into business risk language, quantifying the financial exposure associated with each finding category and connecting remediation investment to specific risk reduction outcomes. This is the document that belongs in front of the board, not just the engineering team.
A prioritized remediation roadmap that sequences findings by risk severity and remediation complexity, with specific investment requirements, timeline estimates, and success criteria for each remediation track. The roadmap should distinguish between findings that require immediate action, findings that belong in the next planning cycle, and findings that can be managed through operational controls while structural remediation is planned.
A baseline for continuous improvement tracking, establishing the current-state metrics against which future progress is measured. An organization that completes a technical audit and has no mechanism for tracking progress against findings has conducted a point-in-time exercise rather than an improvement program.
The CTO's Responsibility in the Audit Process
The technical audit is not something that happens to an engineering team. It is something that the CTO commissions, sponsors, and uses.
The CTO’s responsibility in the audit process begins before the engagement: defining the scope to ensure that the highest-risk areas of the environment receive appropriate scrutiny, establishing the business context that allows auditors to prioritize findings against organizational risk tolerance rather than generic severity scores, and securing the organizational commitment to act on findings rather than file them.
It continues after the output is delivered: translating findings into board-visible risk narrative, incorporating the remediation roadmap into technology budget planning, and establishing the governance mechanism that ensures findings are tracked to resolution rather than acknowledged and deferred.
The technical audit is one of the highest-information-density exercises available to a CTO. It replaces a mental model built from incomplete information with a documented, expert-validated picture of what is actually in the environment. Every significant technology decision made after a comprehensive technical audit is a better decision than it would have been without one, because it is made with accurate information about the actual current state rather than the assumed current state.
The gap between those two states is what a technical audit reveals. And in most enterprise environments, that gap is significantly larger than the CTO expected.
If your organization has not conducted a comprehensive technical audit in the past twelve months, the gap between your assumed technical posture and your actual one is already accumulating cost. Schedule a consultation with our team. We will scope a technical audit calibrated to your specific environment and risk profile, deliver findings in the business language that drives planning decisions, and produce a remediation roadmap that connects technical investment to financial and competitive outcomes.