 iOS App Development
 Android App Development
 React Native
 Flutter
 Web Development
 Custom Software
 Front End Development
 Blockchain Development
 Virtual Reality
 Cloud Computing
 IoT Development
 Augmented Reality
 Write us a message
Most enterprise technology budgets are built around the wrong number. Leadership scrutinises the build estimate, negotiates the statement of work, and approves capital against a single delivery date. Yet for an enterprise app, the build is a one-time event while maintenance is a permanent obligation that runs for the entire operational life of the system. Across industries, software maintenance reliably consumes 50 to 80 percent of total cost of ownership, with the IEEE Computer Society placing the lifecycle share at 60 to 80 percent.
For executive sponsors, the consequence is direct. If you fund the launch and treat the years that follow as a rounding error, you have approved only a fraction of the true cost and accepted a liability that compounds quietly on the balance sheet. This article explains why enterprise applications cost more to maintain than to build, quantifies each cost driver with current data, and sets out the levers available to bring the curve under control.
The Core Economics: Maintenance Is the Larger Half of the Bill
The single most important reframe for any technology investment is that development happens once, while maintenance continues for the lifetime of the system. The pattern is remarkably consistent across analyst firms and engineering benchmarks, and the figures below describe the typical economics of an enterprise application rather than an exceptional case.
- Maintenance accounts for 50 to 80 percent of total cost of ownership across industries and software types, according to IEEE and ISBSG benchmark data.
- Complex on-premises enterprise software can consume 70 to 90 percent of total cost of ownership, while a comparable cloud-based application typically demands 30 to 60 percent.
- Lifetime maintenance commonly totals two to four times the original build. A system thatcost 150,000 dollars to build and runs for eight years may consume 300,000 to 600,000 dollars in maintenance over that period.
- Post-deploymentenhancements alone cost three to four times the original development, according to Standish Group data.
- Organisationsspend 55 to 80 percent of their IT budgets on maintenance rather than new initiatives, per Gartner estimates.
Viewed together, these numbers explain a recurring pattern. The maintenance figure is not an overrun. It is the larger half of the investment that was never properly forecast at approval.
Why the Build Number Misleads the Budget
The original build estimate feels authoritative because it is concrete, time-boxed, and tied to a contract. Maintenance feels abstract because it arrives in small, recurring increments. That asymmetry is precisely what causes the misjudgement at board level, and three dynamics drive it.
- Development is a one-time cost while maintenance is perpetual. Even where annual maintenance is lower than the build, it accumulates across years or decades. A system with a ten-year lifespan might see one to two years of active development and a full decade of maintenance demand.
- Annual maintenance compounds against the original budget. A typical annual maintenance budget runs 15 to 25 percent of the initial development cost. Enterprise systems frequently require 75,000 to more than 125,000 dollars per year, with monthly costs for larger systems ranging from 5,000 to over 50,000 dollars.
- The build captures only one moment in a changing environment. Operating systems update, security vulnerabilities emerge,regulations shift, and user expectations rise. Each of these forces generates billable work that no launch estimate can contain.
The Cost Drivers Behind the Imbalance
Six structural forces explain why maintenance overtakes the build. Each operates independently, and in a large application estate they compound on one another. The sections below quantify each driver so leadership can see where the spend actually originates.
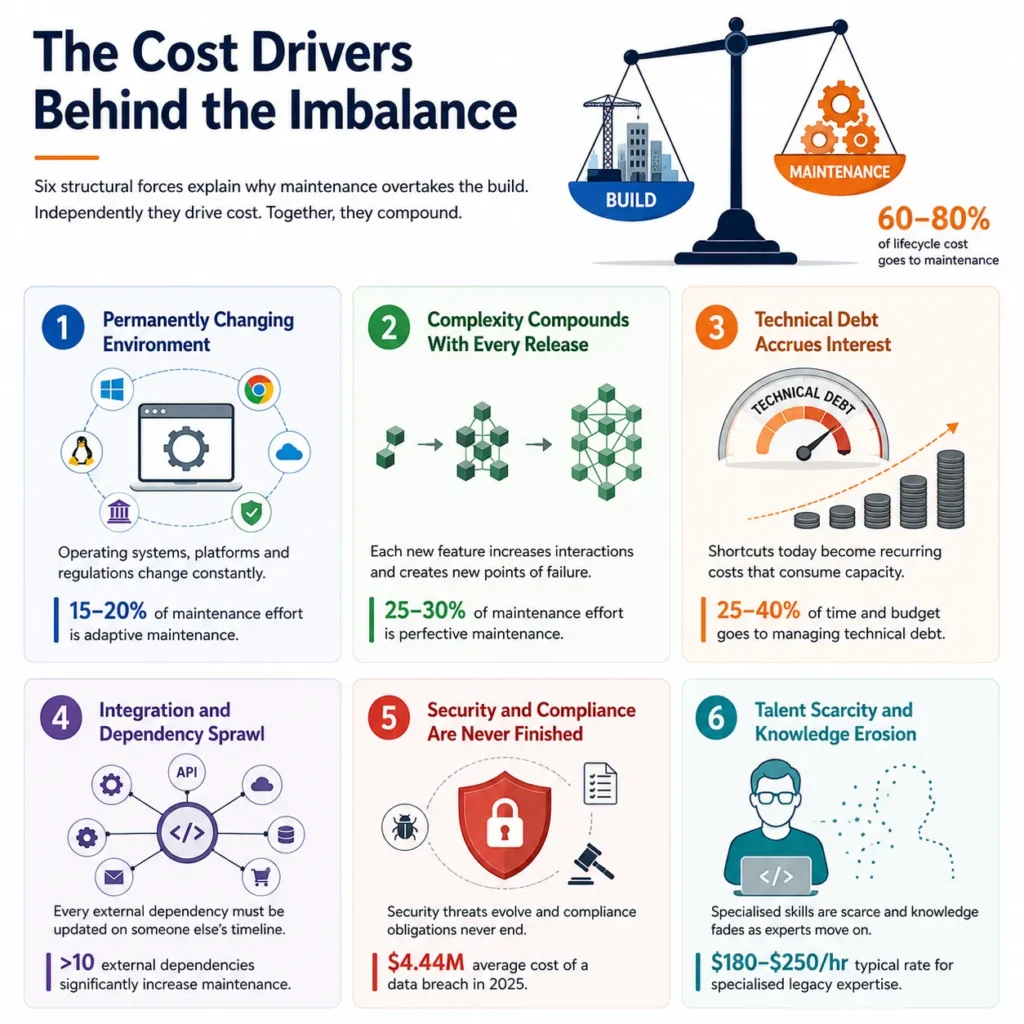
Software Lives in a Permanently Changing Environment
An enterprise application does not operate in isolation. It sits inside an ecosystem of operating systems, browsers, platforms, and regulations that change constantly, and keeping pace with that movement is a recurring cost that begins the day the system goes live.
- Roughly 60 percentof all software lifecyclecost goes toward maintenance under the widely cited 60/60 rule, a figure that rises toward 80 percent for long-lived enterprise systems.
- Adaptive maintenance, the work of keeping pace with changing operating systems and regulatory requirements, accounts for about 15 to 20 percent of total maintenance effort, and more where the environment shiftsfrequently.
Complexity Compounds With Every Release
Maintenance cost is not driven only by defects. Much of it is driven by success, because each improvement adds surface area that every future change must account for.
- As an application evolves, each new feature interacts with existing ones in ways that become harder to predict, creating new points of failure with every addition.
- Perfective maintenance, the enhancement of existing functionality, makes up 25 to 30 percent of maintenance effort, which means asubstantialshare of spend reflects ongoing investment in the product rather than firefighting.
Technical Debt Accrues Interest
Shortcuts taken to ship quickly do not disappear. They become a recurring charge against future capacity, and at portfolio scale that charge consumes a measurable share of the entire technology budget.
- Around 40 percent of the average ITdepartment’sspend is lost to maintaining technical debt, and in organisations with significant legacy systems that figure reaches up to 40 percent of the entire IT budget.
- Gartner reports that 25 percent of engineering time and budget goes toward managing technical debt, while fewer than half oforganisationsbelieve they handle it effectively.
- The Stripe Developer Coefficient finds that 42 percent of professional developer time is consumed by managing technical debt.
- Gartner projects that 80 percent of technical debt will be architectural by 2026, which is the most expensive category to remediate.
Integration and Dependency Sprawl
Modern enterprise applications are assembled from many moving parts that the organisation does not own. Every one of those connections is a standing maintenance obligation that updates on someone else’s timetable.
- Each API integration, third-party library, or external service must be updated whenever a provider changes an interface, deprecates a service, or ships a breaking change.
- Systems with more than ten significant external dependencies consistently require more maintenance effort because the pace of external change sits outside the team’s control.
Security and Compliance Are Never Finished
Security and compliance are not project phases that close. They are continuous obligations, and the cost of falling behind on either is severe and rising in regulated markets.
- The global average cost of a data breach was 4.44 million dollars in 2025, and the United States average reached a record 10.22 million dollars.
- Unpatched and unsupported software is a primarytarget, becauseattackers know ageing modules cannot support modern endpoint detection.
- Compliance frameworks increasingly treat ageing technology as a reportablerisk, andextended-support contracts for end-of-life systems can cost 50 to 200 percent more than standard support.
Talent Scarcity and Knowledge Erosion
The people who can maintain an ageing system become harder to find and more expensive to retain, while the knowledge required to change it safely erodes as the original team moves on.
- Specialisedlegacy contractors now command 180 to 250 dollars per hour, up from 120 dollars in 2022, as institutional knowledge becomes scarce.
- Code that was clear to the original team becomes opaque to later maintainers, raising the effort and risk attached to every change.
The Hidden Costs That Never Reach the Maintenance Line Item
The figures above describe direct maintenance. The larger exposure usually sits in costs that are real, recurring, and rarely attributed to the application at all, which is why they escape budget scrutiny until an incident forces the issue.
- Downtime. In the ITIC 2024 survey, more than 90 percent of mid-size and large enterprises reported that a single hour of downtime exceeds 300,000 dollars, and 41 percent reported costs above 1 million dollars per hour, before litigation and regulatory penalties.
- Productivity drain. Developers working on poorly maintained or legacy code spend a large fraction of their time untangling dependencies rather than building, which converts directly into delayed roadmaps.
- The innovation squeeze. Legacy-heavyorganisationsspend 60 to 80 percent of their IT budgets on maintenance, leaving only 20 to 40 percent for new capability. The U.S. federal government, an extreme but instructive case, allocated 79 percent of a 105 billion dollar annual IT budget to operations and maintenance.
- Operational overhead. IDC reports that enterprisesmaintaininglegacy systems spend up to 42 percent more on operational overhead than those that have modernised.
What This Means for the C-Suite
For a chief executive, chief financial officer, or chief information officer, the maintenance-to-build ratio is not a technical curiosity. It is a leading indicator of capital efficiency and strategic flexibility, and it should be treated with the same rigour as any other recurring commitment.
- Budget on total cost of ownership, not delivery cost. A credible business case for any enterprise application should model five to ten years of maintenance alongside the build, because that is where the majority of the spend will fall.
- Treat the maintenance ratio as a governance metric. When a system consistently consumes far more than the 15 to 25 percent annual benchmark, or when emergency fixes dominate the work, those are quantifiable signals of accumulating debt rather than normal operating cost.
- Recognisethe opportunity cost. Every point of IT budget locked into keeping systems alive is a point unavailable for the products, data capability, and AI initiatives that drive competitive position.
How to Bring Maintenance Costs Under Control
High maintenance cost is not an immutable law. The organisations that keep the ratio healthy share a common discipline, which is to invest earlier in order to avoid more expensive problems later. The following levers are the most reliable.
- Invest in preventive work. Every dollar spent on preventive maintenance, refactoring, improved test coverage, andtimelydependency updates saves an estimated three to five dollars in future corrective work.
- Build automatedtesting infrom the start. Comprehensive automated test suites raise upfront cost by 15 to 35 percent but typically reduce maintenance cost by 30 to 50 percent by catching regressions before production.
- Make architecture decisions with maintenance in mind. Modular design and clear separation of concerns cost more initially and savesubstantially overthe life of the system.
- Move from reactive to continuous funding. Treating technical debt as a real, scheduled cost consistently produces lower overall maintenance spend than firefighting.
- Modernisedeliberately rather than all at once. McKinsey finds thatmodernising infrastructure through cloud adoption or consolidation can yield up to 50 percent savings in total cost, while a phased approach spreads risk and cost.
The Bottom Line
Enterprise application maintenance exceeds the original build cost because the build is a single event and maintenance is a permanent function of a system that lives in a changing environment. The benchmarks are unambiguous. Maintenance represents 50 to 80 percent of total cost of ownership , lifetime maintenance commonly reaches two to four times the build, and post-deployment enhancements alone can cost three to four times the original development.
The organisations that manage this well do not try to eliminate maintenance, which is impossible. They forecast it honestly, govern it as a strategic line item, and invest early in the architecture, testing, and modernisation discipline that keeps the ratio sustainable. That choice is the difference between an application portfolio that compounds value and one that quietly compounds liability.
Wondering why your enterprise application is becoming more expensive to maintain every year? Schedule a free consultation with our experts to evaluate your application’s architecture, performance, security, technical debt, and ongoing maintenance costs. We’ll help you identify cost-saving opportunities, prioritize critical improvements, and create a practical maintenance strategy that keeps your application reliable, scalable, and aligned with your long-term business goals.